

Solana Price Today: SOL Pinned at $71 as Fear Index Drops to 15
The crypto market remains under pressure and Solana price today reflects that strain, with SOL trading at $71.65 on June 18, 2026. The daily chart shows a bearish structure with price pinned below every major moving average, while Bitcoin dominance at 56.2% continues to drain capital from altcoins.
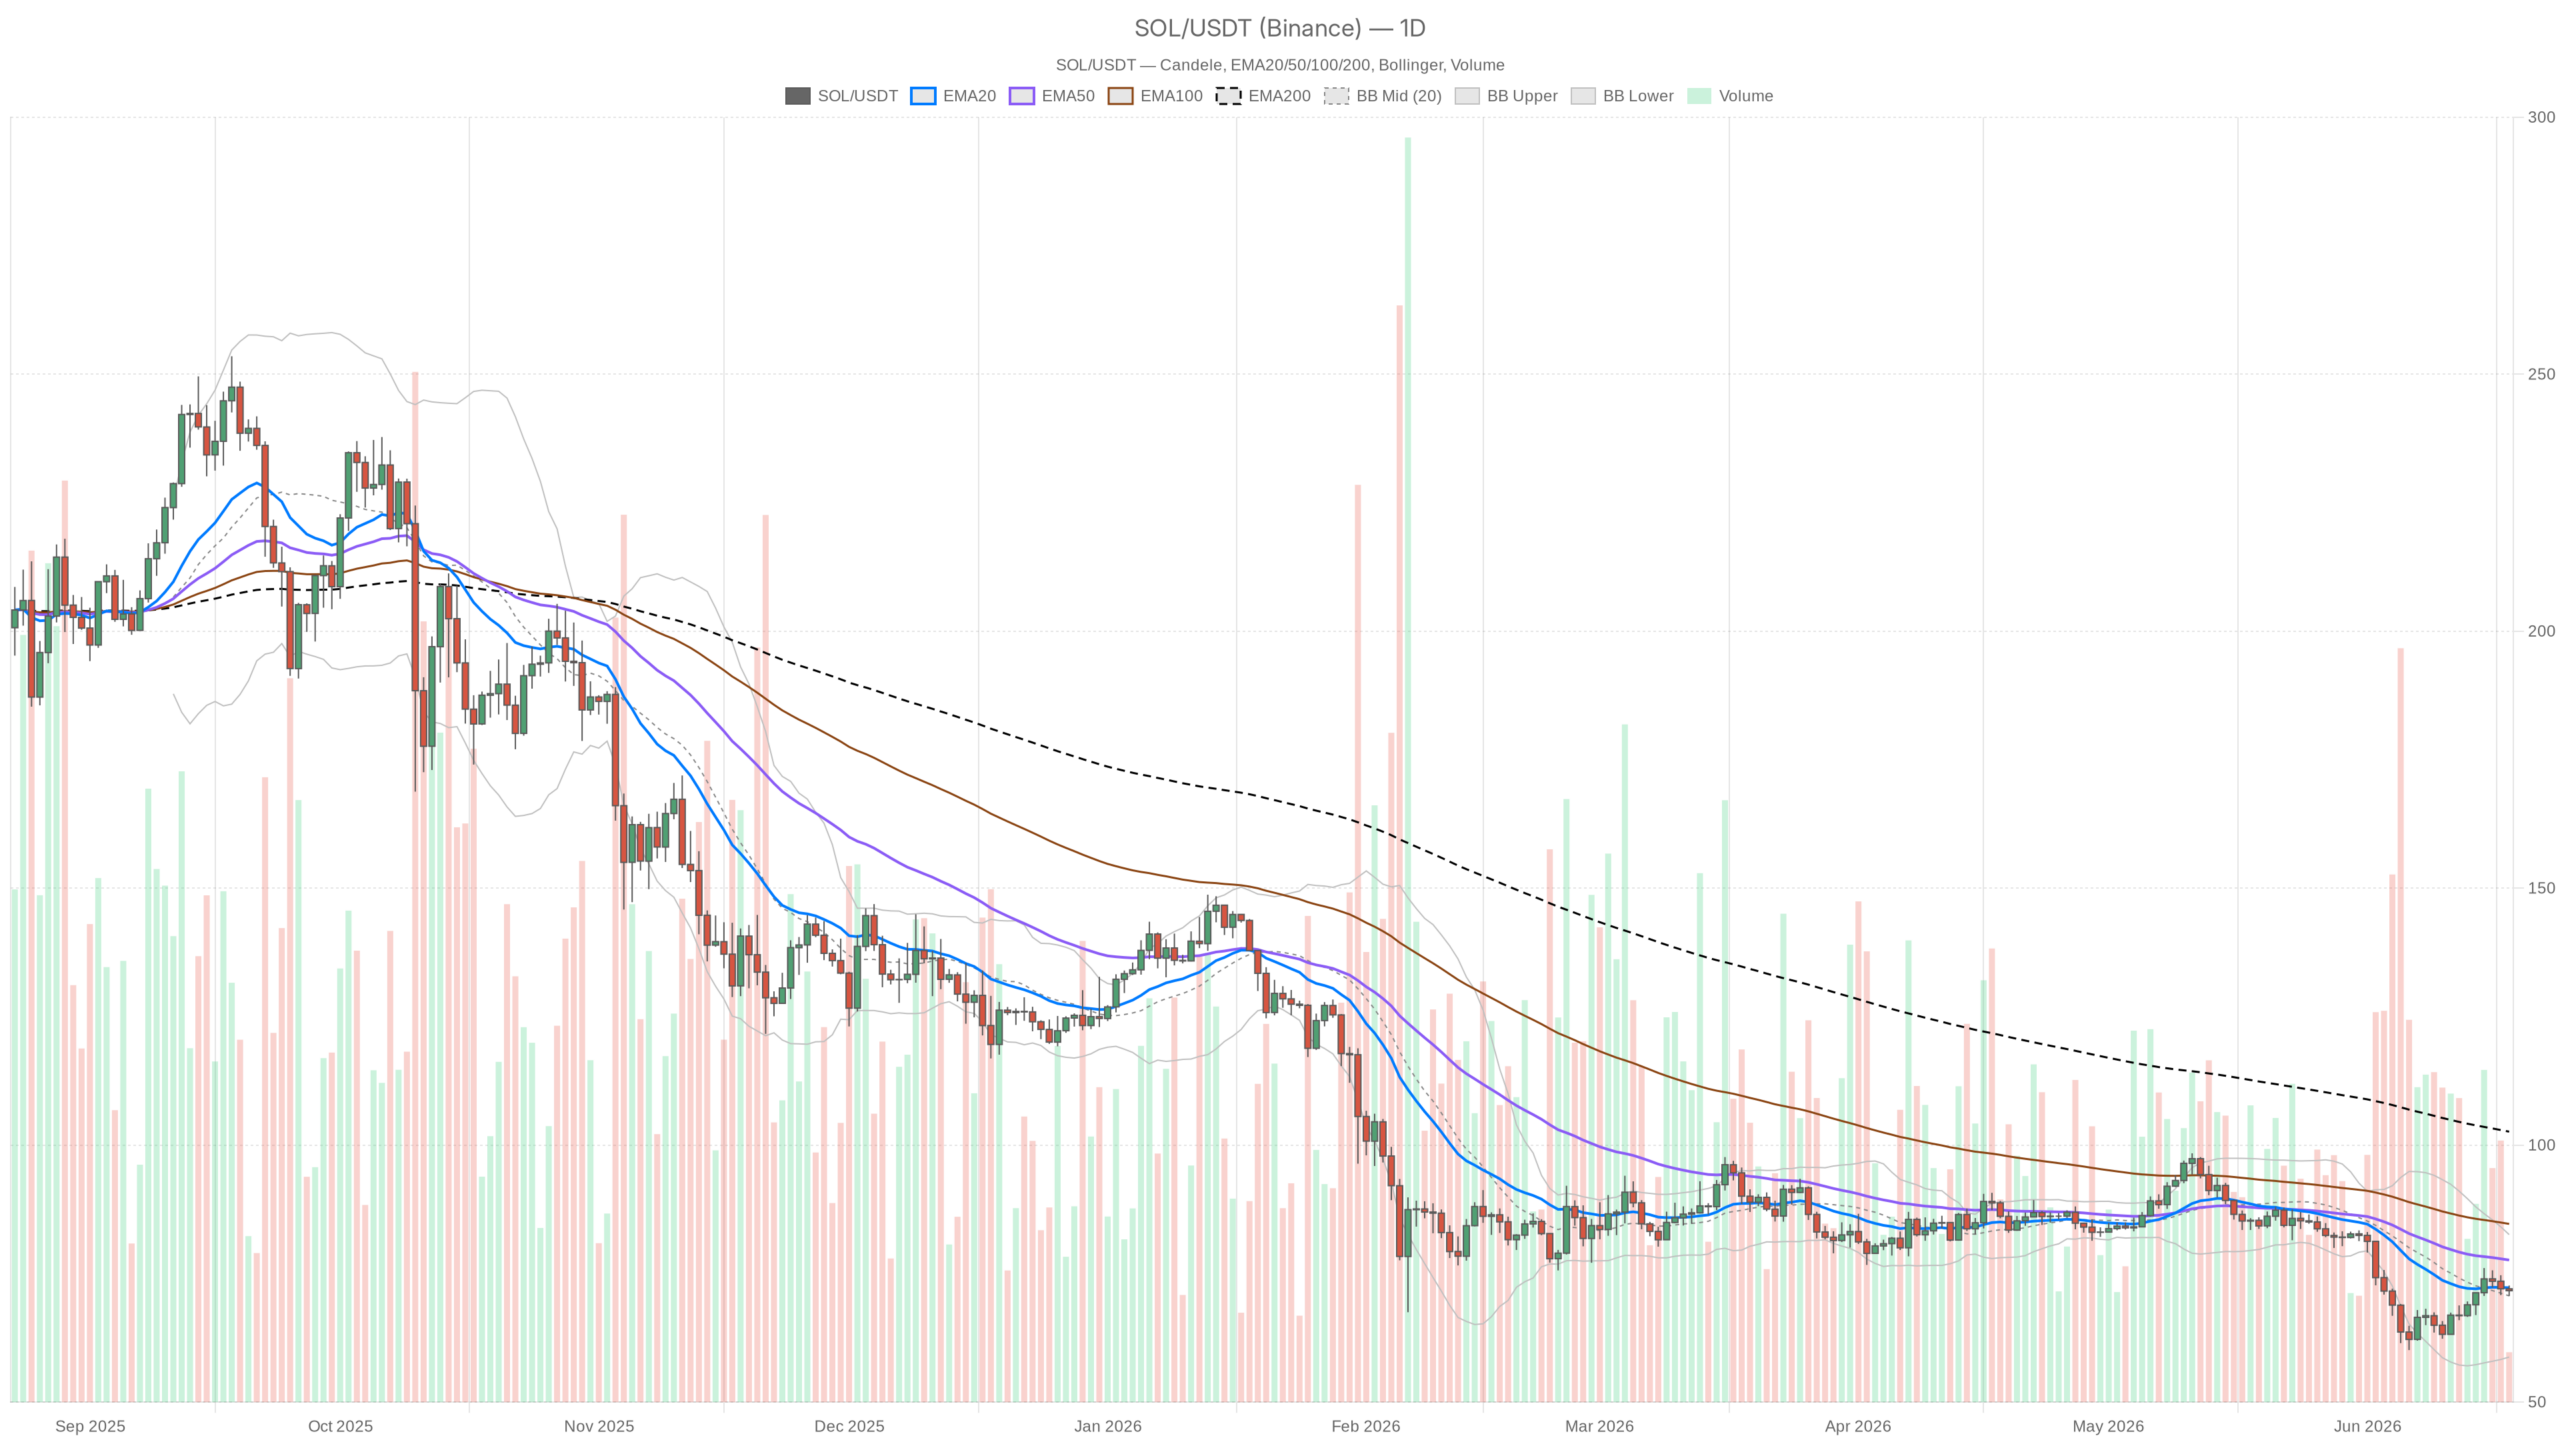 SOL/USDT — daily chart with candlesticks, EMA20/EMA50 and volume.
Key takeaways
- SOL is trading at $71.65, below the 20-day EMA at $72.26 and 50-day EMA at $77.65, confirming a bearish daily structure.
- The Fear & Greed Index sits at 15 (Extreme Fear), historically a capitulation zone but not yet a reliable reversal signal.
- Daily MACD histogram has turned positive at +1.19, suggesting downside momentum is decelerating without confirming a trend shift.
- DeFi activity on Solana remains active, with Orca DEX posting +64.75% in 30-day fees, though this hasn’t translated into price support.
- A daily close above the EMA20 at $72.26 is the minimum requirement for any credible bullish scenario to emerge.
The Daily Chart: A Bearish Regime With a Hint of Relief
The daily chart confirms Solana remains in a bearish regime, with price trading below all major moving averages. However, a positive MACD histogram divergence hints that the pace of selling is slowing.
The daily regime is classified as bearish, and Solana price today confirms why. SOL closed at $71.68, trading below both its 20-day EMA at $72.26 and its 50-day EMA at $77.65. The 200-day EMA sits far above at $102.63 — a level that functions more as a reminder of how much ground has been lost than as a near-term target. Every significant EMA is stacked above price, forming a wall of resistance rather than a floor of support.
The daily RSI at 45.52 is parked in bearish territory, below the neutral 50 line but not yet at levels that would scream maximum pessimism. That is the uncomfortable part — there is still room to fall before RSI hits the kind of oversold extremes that tend to trigger sharp bounces. The MACD line at -2.63 remains below the signal line at -3.82, but the histogram has turned positive at +1.19. That divergence suggests the downside momentum is decelerating. It is not a buy signal — it is a warning that the trend may be losing velocity, not reversing.
Meanwhile, Bollinger Bands on the daily frame show a midline at $70.68 with the upper band at $82.60 and the lower band at $58.77. Price is essentially hugging the midline, which tends to happen during directionless pressure or brief pauses in a trend. The ATR of $4.14 confirms that volatility is present and meaningful — a daily swing of $4 in either direction is entirely on the table, which traders need to respect when sizing positions.
Daily pivot sits at $71.67 with R1 at $72.69 and S1 at $70.65. The price is essentially sitting on its own pivot — the definition of a market that has not decided anything yet on a session basis, even if the broader trend is clear.
Hourly Structure: Neutral, But Quietly Under Pressure
The hourly chart shifts to neutral but shows price slipping below key short-term averages, keeping pressure on the downside.
The 1-hour regime shifts from bearish to neutral, which sounds encouraging until you examine the details. Price at $71.64 sits below the 1H EMA20 at $72.09 and the 1H EMA50 at $72.50, but remains above the 1H EMA200 at $70.12. That last point is the one thread of support preventing a full intraday collapse — SOL is holding above its long-term hourly average, but barely.
Moreover, the 1H RSI at 43.63 mirrors the daily weakness without reaching oversold, and the MACD histogram on this timeframe just ticked negative at -0.03 — a marginal but directionally concerning signal. The hourly Bollinger Band midline is at $72.25, and price has slipped below it. This keeps the short-term path of least resistance pointed lower. Meanwhile, the pivot cluster on the 1H frame is extremely tight, with PP at $71.70, R1 at $71.75, and S1 at $71.58. The market is coiling in a narrow range, meaning a break in either direction will likely be amplified.
15-Minute: The Only Timeframe Showing Any Green
The 15-minute chart offers the only short-term stabilization signal, with RSI back above 50 and a positive MACD histogram, though resistance sits close above.
The 15-minute chart remains the lone bright spot in this analysis, though even that requires qualification. RSI at 51.58 has crossed back above 50, and the MACD histogram has flipped positive at +0.10. Price at $71.65 also sits above the 15M EMA20 at $71.53 — a short-term positive. However, the 15M EMA200 at $72.65 looms above as resistance, and the Bollinger upper band at $71.93 sits just $0.28 away, leaving little room before a ceiling is hit.
In other words, for anyone considering intraday positioning, the 15M data is useful only as a timing tool. It suggests the very near-term micro-momentum has stabilized, but this is execution-level context, not a macro signal. The daily regime has not changed.
Solana DeFi Activity: A Mixed Picture from the Ecosystem
On-chain data paints a mixed picture: Solana’s DeFi ecosystem shows pockets of genuine growth, but that activity has not lifted SOL’s price amid the broader risk-off environment.
Among the top DEXs active on Solana’s network, Orca DEX is posting a 30-day fee change of +64.75% and Meteora DLMM is up +63.66% over the same period — that reflects genuine ecosystem usage growth. On the other hand, HumidiFi is down 14.54% over 30 days and BisonFi is off 36.87% over a week. This divergence suggests fee volume is concentrating around a handful of protocols rather than expanding broadly.
That said, this kind of divergence within the DeFi layer is neither bullish nor bearish in isolation, but it tells you the ecosystem is not dead. Raydium AMM’s fees are up 15.44% in the last 24 hours, and Orca is up 21.69% on the day. There is real activity. The problem is that on-chain activity and token price can decouple for extended periods, especially when macro fear and Bitcoin dominance remain elevated. Activity does not automatically translate into SOL price appreciation when risk appetite across the entire space is crushed.
Bullish Scenario: What Would Need to Happen
For a bullish reversal to gain credibility, SOL must reclaim the daily EMA20 at $72.26 on a closing basis, opening the path toward the $77-$78 resistance zone.
For a credible bullish case to emerge, SOL must first reclaim the daily EMA20 at $72.26 on a closing basis — not a wick, not an intraday print, but a daily close. That would open the door toward the $77-$78 zone where the 50-day EMA sits. The 50-day EMA would then become the real test of whether this marks a recovery or just a dead-cat bounce.
A broader rotation out of Bitcoin and into altcoins would provide the necessary macro backdrop. This would be visible as BTC dominance dropping meaningfully below 55%. Moreover, the decelerating MACD histogram on the daily chart and the ecosystem activity from Orca and Meteora offer supporting evidence that a base could form at current levels.
However, this scenario gets invalidated quickly if SOL fails to hold the $70.65 daily S1 and begins printing closes below $70. At that point, the lower Bollinger Band at $58.77 becomes the next meaningful technical reference, and the conversation shifts from recovery attempt to how deep this goes.
Bearish Scenario: The More Likely Path While Structure Holds
The bearish scenario remains the base case as long as SOL trades below all major daily EMAs and Bitcoin dominance stays above 55%, with a break below $71 threatening a slide toward $68-$69.
The base case, given the weight of evidence, remains bearish. Every major daily EMA sits above price, RSI has not reached oversold levels, and the Fear & Greed Index at 15 reflects market-wide panic — sellers are likely still active. Meanwhile, BTC dominance at 56.17% signals that capital is hiding in relative safety rather than rotating into mid-cap layer-1s like Solana.
A failure to hold the $71-$71.50 zone on the hourly could trigger a leg down toward $68-$69 quickly, given the ATR of $4.14. Below that, $65 becomes technically relevant.
The bearish scenario is invalidated only by a strong, sustained daily close above the EMA20 at $72.26. Such a move would need to be accompanied by a pickup in volume and a shift in the broader risk environment.
Where Does This Leave Traders?
SOL at $71.65 sits in no man’s land — technically bearish, emotionally oversold, and lacking a clean directional setup for traders on either side.
SOL at $71.65 is not a comfortable position from any directional standpoint. The daily structure remains broken, the macro environment is hostile to altcoins, and the sentiment backdrop at Extreme Fear suggests the market is not ready to commit to a recovery. The small flickers of stabilization on the 15-minute chart and the decelerating daily MACD histogram are worth noting. However, they are not the same as a confirmed trend shift.
The ATR of $4.14 on the daily means any position taken here carries significant intraday risk. Traders who are short should recognize that MACD divergence and an Extreme Fear reading can produce sharp, painful short squeezes even within downtrends.
Traders considering longs need to wait for the daily EMA20 to act as support confirmed by a price close above it — not before. The setup is not clean enough to chase in either direction.
The honest read is that SOL remains in no man’s land: technically bearish, emotionally oversold, and ecosystem-active but not yet price-reactive. Markets can stay irrational longer than most expect, and this particular moment demands patience over conviction.
FAQ
What is Solana’s price today?
Solana is trading at $71.65 as of June 18, 2026, stuck below its daily 20-day EMA at $72.26 and operating within a bearish macro structure.
Is Solana in a bear market?
Yes. The daily chart classifies as bearish, with SOL trading below the 20-day, 50-day, and 200-day EMAs. RSI at 45.52 remains in bearish territory, and no confirmed trend reversal has occurred.
What needs to happen for Solana to turn bullish?
SOL must close above the daily EMA20 at $72.26 on a sustained basis. From there, the 50-day EMA at $77.65 becomes the next critical test. A drop in Bitcoin dominance below 55% would also support the case.
What does the Fear & Greed Index indicate right now?
The broader crypto Fear & Greed Index sits at 15, deep within Extreme Fear territory. This often signals capitulation but does not guarantee an immediate price reversal.
&&
Disclaimer: This article is for informational purposes only and does not constitute financial advice, an investment recommendation, or a solicitation to buy or sell any financial instrument or cryptocurrency. The analysis provided is not indicative of future results. Investing in crypto assets and financial markets carries a high risk of capital loss. Always do your own research (DYOR) and consult a qualified financial advisor before making any decision.
Article produced with the assistance of artificial intelligence and reviewed by the editorial team.


You May Also Like

Barack Obama shades Trump during speech at presidential center: 'There will be no kings'

Pathologist warns of Trump’s 'observable signs' of rapid 'severe decline'

At The Money: Deregulation Will Free Your Portfolio


Trending News
More24/7 Live News
More
