Bitcoin Magazine Bitcoin Price Flash Crashes from $61,000 to $58,000 as Market Waits For Support Bitcoin price plunged from $61,000 to $58,000 in a sharp sell-Bitcoin Magazine Bitcoin Price Flash Crashes from $61,000 to $58,000 as Market Waits For Support Bitcoin price plunged from $61,000 to $58,000 in a sharp sell-

Bitcoin Price Flash Crashes from $61,000 to $58,000 as Market Waits For Support

For feedback or concerns regarding this content, please contact us at crypto.news@mexc.com

Bitcoin Magazine

Bitcoin Price Flash Crashes from $61,000 to $58,000 as Market Waits For Support

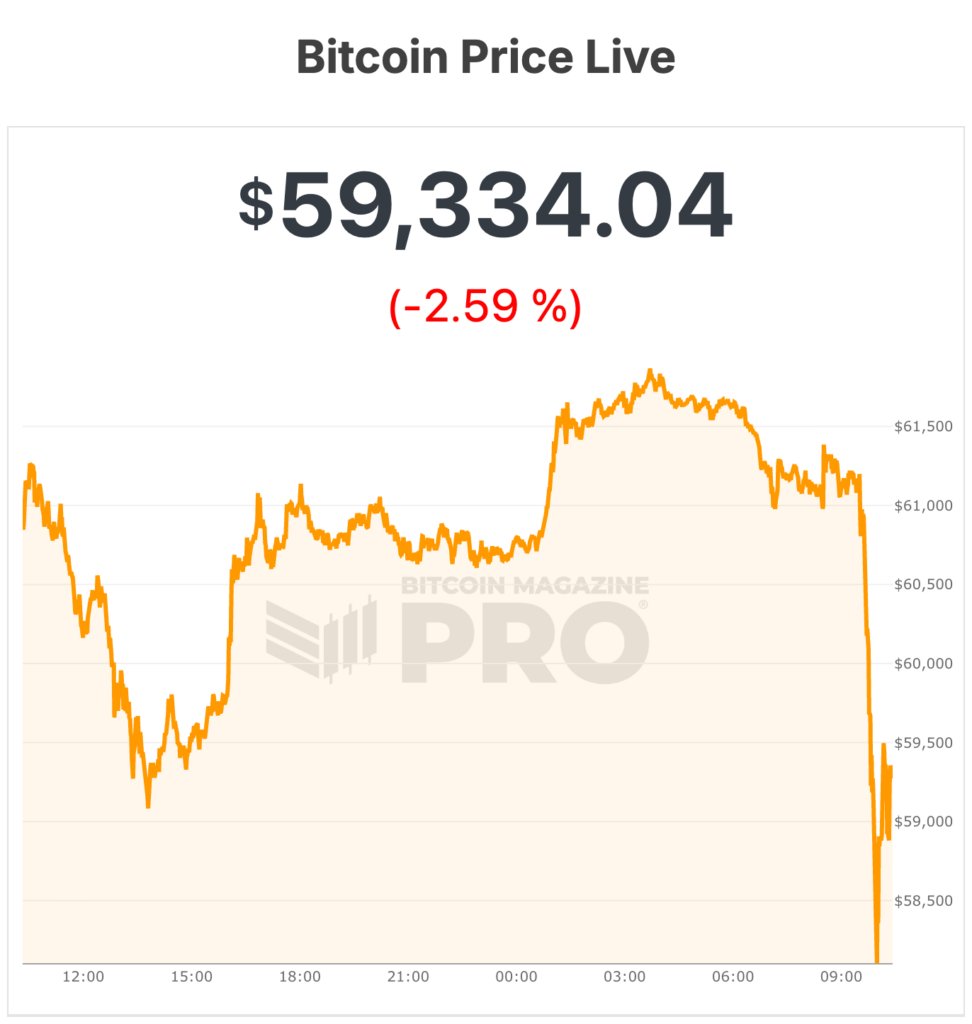
Bitcoin price plunged to an intraday low of approximately $58,000 Thursday morning before staging a partial recovery, as a bear market that began after October’s all-time high shows no clear signs of exhaustion — and a closely watched long-term valuation model appears to have broken for the first time in its history.

The world’s largest cryptocurrency by market cap was trading around $59,315 as of mid-morning Thursday, down more than 3% on the day and roughly 53% below its October 6, 2025 all-time high of $126,198. 

Bitcoin price rallied as high as $61,868 in the early hours before sellers overwhelmed buyers, sending the price off a cliff in a matter of minutes.

Thursday’s flash crash followed an already bruising 24 hours. On Wednesday, Bitcoin had already traded below $60,000 for a time at the lower support trendline of the Bitcoin Power Law — a long-term valuation model popularized by physicist Giovanni Santostasi that plots price against time on a logarithmic scale and has historically contained all of Bitcoin’s price action for over a decade. 

Analysts tracking the model noted that while Bitcoin has flirted with the floor in past market dislocations — most notably during the March 2020 COVID crash and the FTX collapse in November 2022 — a sustained close below the support band had never been registered until this week.

The bitcoin price support trendline, which drifts upward roughly 0.093% per day as Bitcoin’s network matures, was sitting in the low $60,000s at the time of the breakdown. Thursday’s intraday dip to the $58,000s pushed prices further below that level, deepening the historic deviation.

Whether the breach constitutes a structural breakdown of the model — or a temporary excursion that will ultimately resolve higher — is up for debate. 

Historically, the Power Law Oscillator reaching extreme lows has preceded significant recoveries.

Bitcoin price sell-off

The macro backdrop driving the selloff over the last couple months is well-documented. Spot Bitcoin ETFs have seen outflows in the billions in recent weeks. Strategy sold Bitcoin for the first time in four years, rattling institutional confidence. 

Escalating U.S.-Iran tensions have sent oil prices higher, reviving inflation fears and prompting some Federal Reserve officials to float the possibility of rate hikes rather than cuts.

Capital rotation out of crypto and into AI-related equities has compounded the pressure, with investors chasing a different technology narrative entirely.

With Bitcoin price now sitting more than 50% below its all-time high and the Power Law model in uncharted territory, bulls face a critical test with bears clearly in control. 

bitcoin price

This post Bitcoin Price Flash Crashes from $61,000 to $58,000 as Market Waits For Support first appeared on Bitcoin Magazine and is written by Micah Zimmerman.

Disclaimer: The articles reposted on this site are sourced from public platforms and are provided for informational purposes only. They do not necessarily reflect the views of MEXC. All rights remain with the original authors. If you believe any content infringes on third-party rights, please contact crypto.news@mexc.com for removal. MEXC makes no guarantees regarding the accuracy, completeness, or timeliness of the content and is not responsible for any actions taken based on the information provided. The content does not constitute financial, legal, or other professional advice, nor should it be considered a recommendation or endorsement by MEXC.

You May Also Like

Ethereum koers toont zeldzaam dubbel koopsignaal en richt zich op $4.550

Ethereum koers toont zeldzaam dubbel koopsignaal en richt zich op $4.550

Connect met Like-minded Crypto Enthusiasts! Connect op Discord! Check onze Discord   Ethereum laat op de uurgrafiek twee opeenvolgende TD Sequential koopsignalen zien. Deze indicator meet uitputting in een trend en geeft vaak een signaal dat de verkoopdruk kan afnemen. Dit dubbele signaal verschijnt rond het niveau van $4.516, waar de ETH prijs kortstondig steun vindt. Dit type formatie komt zelden voor en wordt daarom extra nauwlettend gevolgd. Wat gaat de Ethereum koers hiermee doen? Ethereum koers test steun rond $4.516 De scherpe daling van de Ethereum koers vanaf de prijszone rond $4.800 bracht de ETH prijs in korte tijd naar ongeveer $4.516. Op dit niveau trad duidelijke koopactiviteit op, waardoor de neerwaartse beweging tijdelijk werd gestopt. Het dubbele signaal dat door de TD Sequential indicator is gegenereerd, viel precies samen met dit prijspunt. De TD Sequential is opgebouwd uit negen candles die een trend meetellen. Wanneer de negende candle verschijnt, kan dit duiden op een trendomslag. In dit geval verschenen zelfs twee signalen kort na elkaar, wat aangeeft dat de verkoopdruk mogelijk uitgeput is. Het feit dat dit gebeurde in een zone waar ETH kopers actief bleven, maakt het patroon extra opvallend. TD Sequential just flashed two buy signals for Ethereum $ETH! pic.twitter.com/JPO8EhiEPi — Ali (@ali_charts) September 16, 2025 Welke crypto nu kopen?Lees onze uitgebreide gids en leer welke crypto nu kopen verstandig kan zijn! Welke crypto nu kopen? Fed-voorzitter Jerome Powell heeft aangekondigd dat de rentes binnenkort zomaar eens omlaag zouden kunnen gaan, en tegelijkertijd blijft BlackRock volop crypto kopen, en dus lijkt de markt klaar om te gaan stijgen. Eén vraag komt telkens terug: welke crypto moet je nu kopen? In dit artikel bespreken we de munten die… Continue reading Ethereum koers toont zeldzaam dubbel koopsignaal en richt zich op $4.550 document.addEventListener('DOMContentLoaded', function() { var screenWidth = window.innerWidth; var excerpts = document.querySelectorAll('.lees-ook-description'); excerpts.forEach(function(description) { var excerpt = description.getAttribute('data-description'); var wordLimit = screenWidth wordLimit) { var trimmedDescription = excerpt.split(' ').slice(0, wordLimit).join(' ') + '...'; description.textContent = trimmedDescription; } }); }); Technische indicatoren schetsen herstelkans voor ETH Naast de dubbele koopsignalen verstrekken ook andere indicatoren belangrijke aanwijzingen. Tijdens de daling van de ETH koers waren grote rode candles zichtbaar, maar na de test van $4.516 stabiliseerde de Ethereum koers. Dit wijst op een mogelijke verschuiving in het evenwicht tussen de bears en bulls. Als deze opwaartse beweging doorzet, liggen de eerste weerstanden rond $4.550. Daarboven wacht een sterkere zone rond $4.650. Deze niveaus zijn in eerdere Ethereum sessies al meerdere keren getest. Een doorbraak zou ruimte openen richting de all-time high van ETH rond $4.953. Wanneer de prijs toch opnieuw onder $4.516 zakt, liggen er zones rond $4.500 en $4.450 waar grotere kooporders worden verwacht. Deze niveaus kunnen als een vangnet fungeren, mocht de druk opnieuw toenemen. Marktdynamiek bevestigt technische indicatoren De huidige situatie volgt op een bredere correctie in de cryptomarkt. Verschillende vooraanstaande crypto tokens zagen scherpe koersdalingen, waarna traders op zoek gingen naar signalen voor een mogelijke ommekeer. Dat juist Ethereum nu een dubbel TD Sequential signaal toont, versterkt de interesse in dit scenario. Fundamenteel blijft Ethereum sterk. Het aantal ETH tokens dat via staking is vastgezet, blijft groeien. Dat verkleint de vrije circulatie en vermindert verkoopdruk. Tegelijk blijft het netwerk intensief gebruikt voor DeFi, NFT’s en stablecoins. Deze activiteiten zorgen voor een stabiele vraag naar ETH, ook wanneer de prijs tijdelijk onder druk staat. Fundamentele drijfveren achter de Ethereum koers De Ethereum koers wordt echter niet alleen bepaald door candles en patronen, maar ook door bredere factoren. Een stijgend percentage van de totale ETH supply staat vast in staking contracten. Hierdoor neemt de liquiditeit op exchanges af. Dit kan prijsschommelingen versterken wanneer er plotseling meer koopdruk ontstaat. Daarnaast is Ethereum nog steeds het grootste smart contract platform. Nieuwe standaarden zoals ERC-8004 en ontwikkelingen rond layer-2 oplossingen houden de activiteit hoog. Deze technologische vooruitgang kan de waardepropositie ondersteunen en zo indirect bijdragen aan een ETH prijsherstel. Het belang van de korte termijn dynamiek De komende handelsdagen zullen duidelijk maken of de bulls genoeg kracht hebben om door de weerstandszone rond $4.550 te breken. Voor de bears ligt de focus juist op het verdedigen van de prijsregio rond $4.516. De whales, die met grote handelsorders opereren, kunnen hierin een beslissende rol spelen. Het dubbele TD Sequential signaal blijft hoe dan ook een zeldzame gebeurtenis. Voor cryptoanalisten vormt het een objectief aanknopingspunt om de kracht van de huidige Ethereum trend te toetsen. Vooruitblik op de ETH koers Ethereum liet twee opeenvolgende TD Sequential signalen zien op de uurgrafiek, iets wat zelden voorkomt. Deze formatie viel samen met steun rond $4.516, waar de bulls actief werden. Als de Ethereum koers boven dit niveau blijft, kan er ruimte ontstaan richting $4.550 en mogelijk $4.650. Zakt de prijs toch opnieuw onder $4.516, dan komen $4.500 en $4.450 in beeld als nieuwe steunzones. De combinatie van zeldzame indicatoren en een sterke fundamentele basis maakt Ethereum interessant voor zowel technische als fundamentele analyses. Of de bulls het momentum echt kunnen overnemen, zal blijken zodra de Ethereum koers de eerstvolgende weerstanden opnieuw test. Koop je crypto via Best Wallet Best wallet is een topklasse crypto wallet waarmee je anoniem crypto kan kopen. Met meer dan 60 chains gesupport kan je al je main crypto coins aanschaffen via Best Wallet. Best wallet - betrouwbare en anonieme wallet Best wallet - betrouwbare en anonieme wallet Meer dan 60 chains beschikbaar voor alle crypto Vroege toegang tot nieuwe projecten Hoge staking belongingen Lage transactiekosten Best wallet review Koop nu via Best Wallet Let op: cryptocurrency is een zeer volatiele en ongereguleerde investering. Doe je eigen onderzoek. Het bericht Ethereum koers toont zeldzaam dubbel koopsignaal en richt zich op $4.550 is geschreven door Dirk van Haaster en verscheen als eerst op Bitcoinmagazine.nl.
Share
Coinstats2025/09/17 23:31
Fed Day Dry Powder: Cryptoquant Analyst Tracks $7.6B Stablecoin Pile on Exchanges

Fed Day Dry Powder: Cryptoquant Analyst Tracks $7.6B Stablecoin Pile on Exchanges

The post Fed Day Dry Powder: Cryptoquant Analyst Tracks $7.6B Stablecoin Pile on Exchanges appeared on BitcoinEthereumNews.com. With the Federal Reserve meeting today, onchain flows are telegraphing that crypto traders are topping off exchanges and leaning long ahead of a widely expected 25-basis-point cut. Pre-Fed Positioning Stablecoins are doing the heavy lifting. Cryptoquant data shows $7.6 billion in fresh USDT and USDC (ERC-20) deposits heading to trading venues ahead of the decision. […] Source: https://news.bitcoin.com/fed-day-dry-powder-cryptoquant-analyst-tracks-7-6b-stablecoin-pile-on-exchanges/
Share
BitcoinEthereumNews2025/09/18 01:36
Michael Saylor’s Bitcoin Treasury Strategy Has Finally Hit Its Breaking Point

Michael Saylor’s Bitcoin Treasury Strategy Has Finally Hit Its Breaking Point

Bitcoin (CRYPTO:BTC) transformed from a niche digital asset into a mainstream investment over the past decade, and few people did more to accelerate that shift
Share
247 Wall St.2026/06/28 20:17

Newbies:Deposit $100, Get $1,000

Newbies:Deposit $100, Get $1,000Newbies:Deposit $100, Get $1,000

Plus Up to a $50 Referral Bonus