

Netflix Stock Down 45% From Peak — Even a 5.3% Bounce Can’t Break the Trend

Netflix stock remains under serious pressure despite a late-session bounce on June 26. NFLX sits in a confirmed bearish regime, trading below all key moving averages. The structural damage on higher timeframes keeps the primary bias firmly bearish.
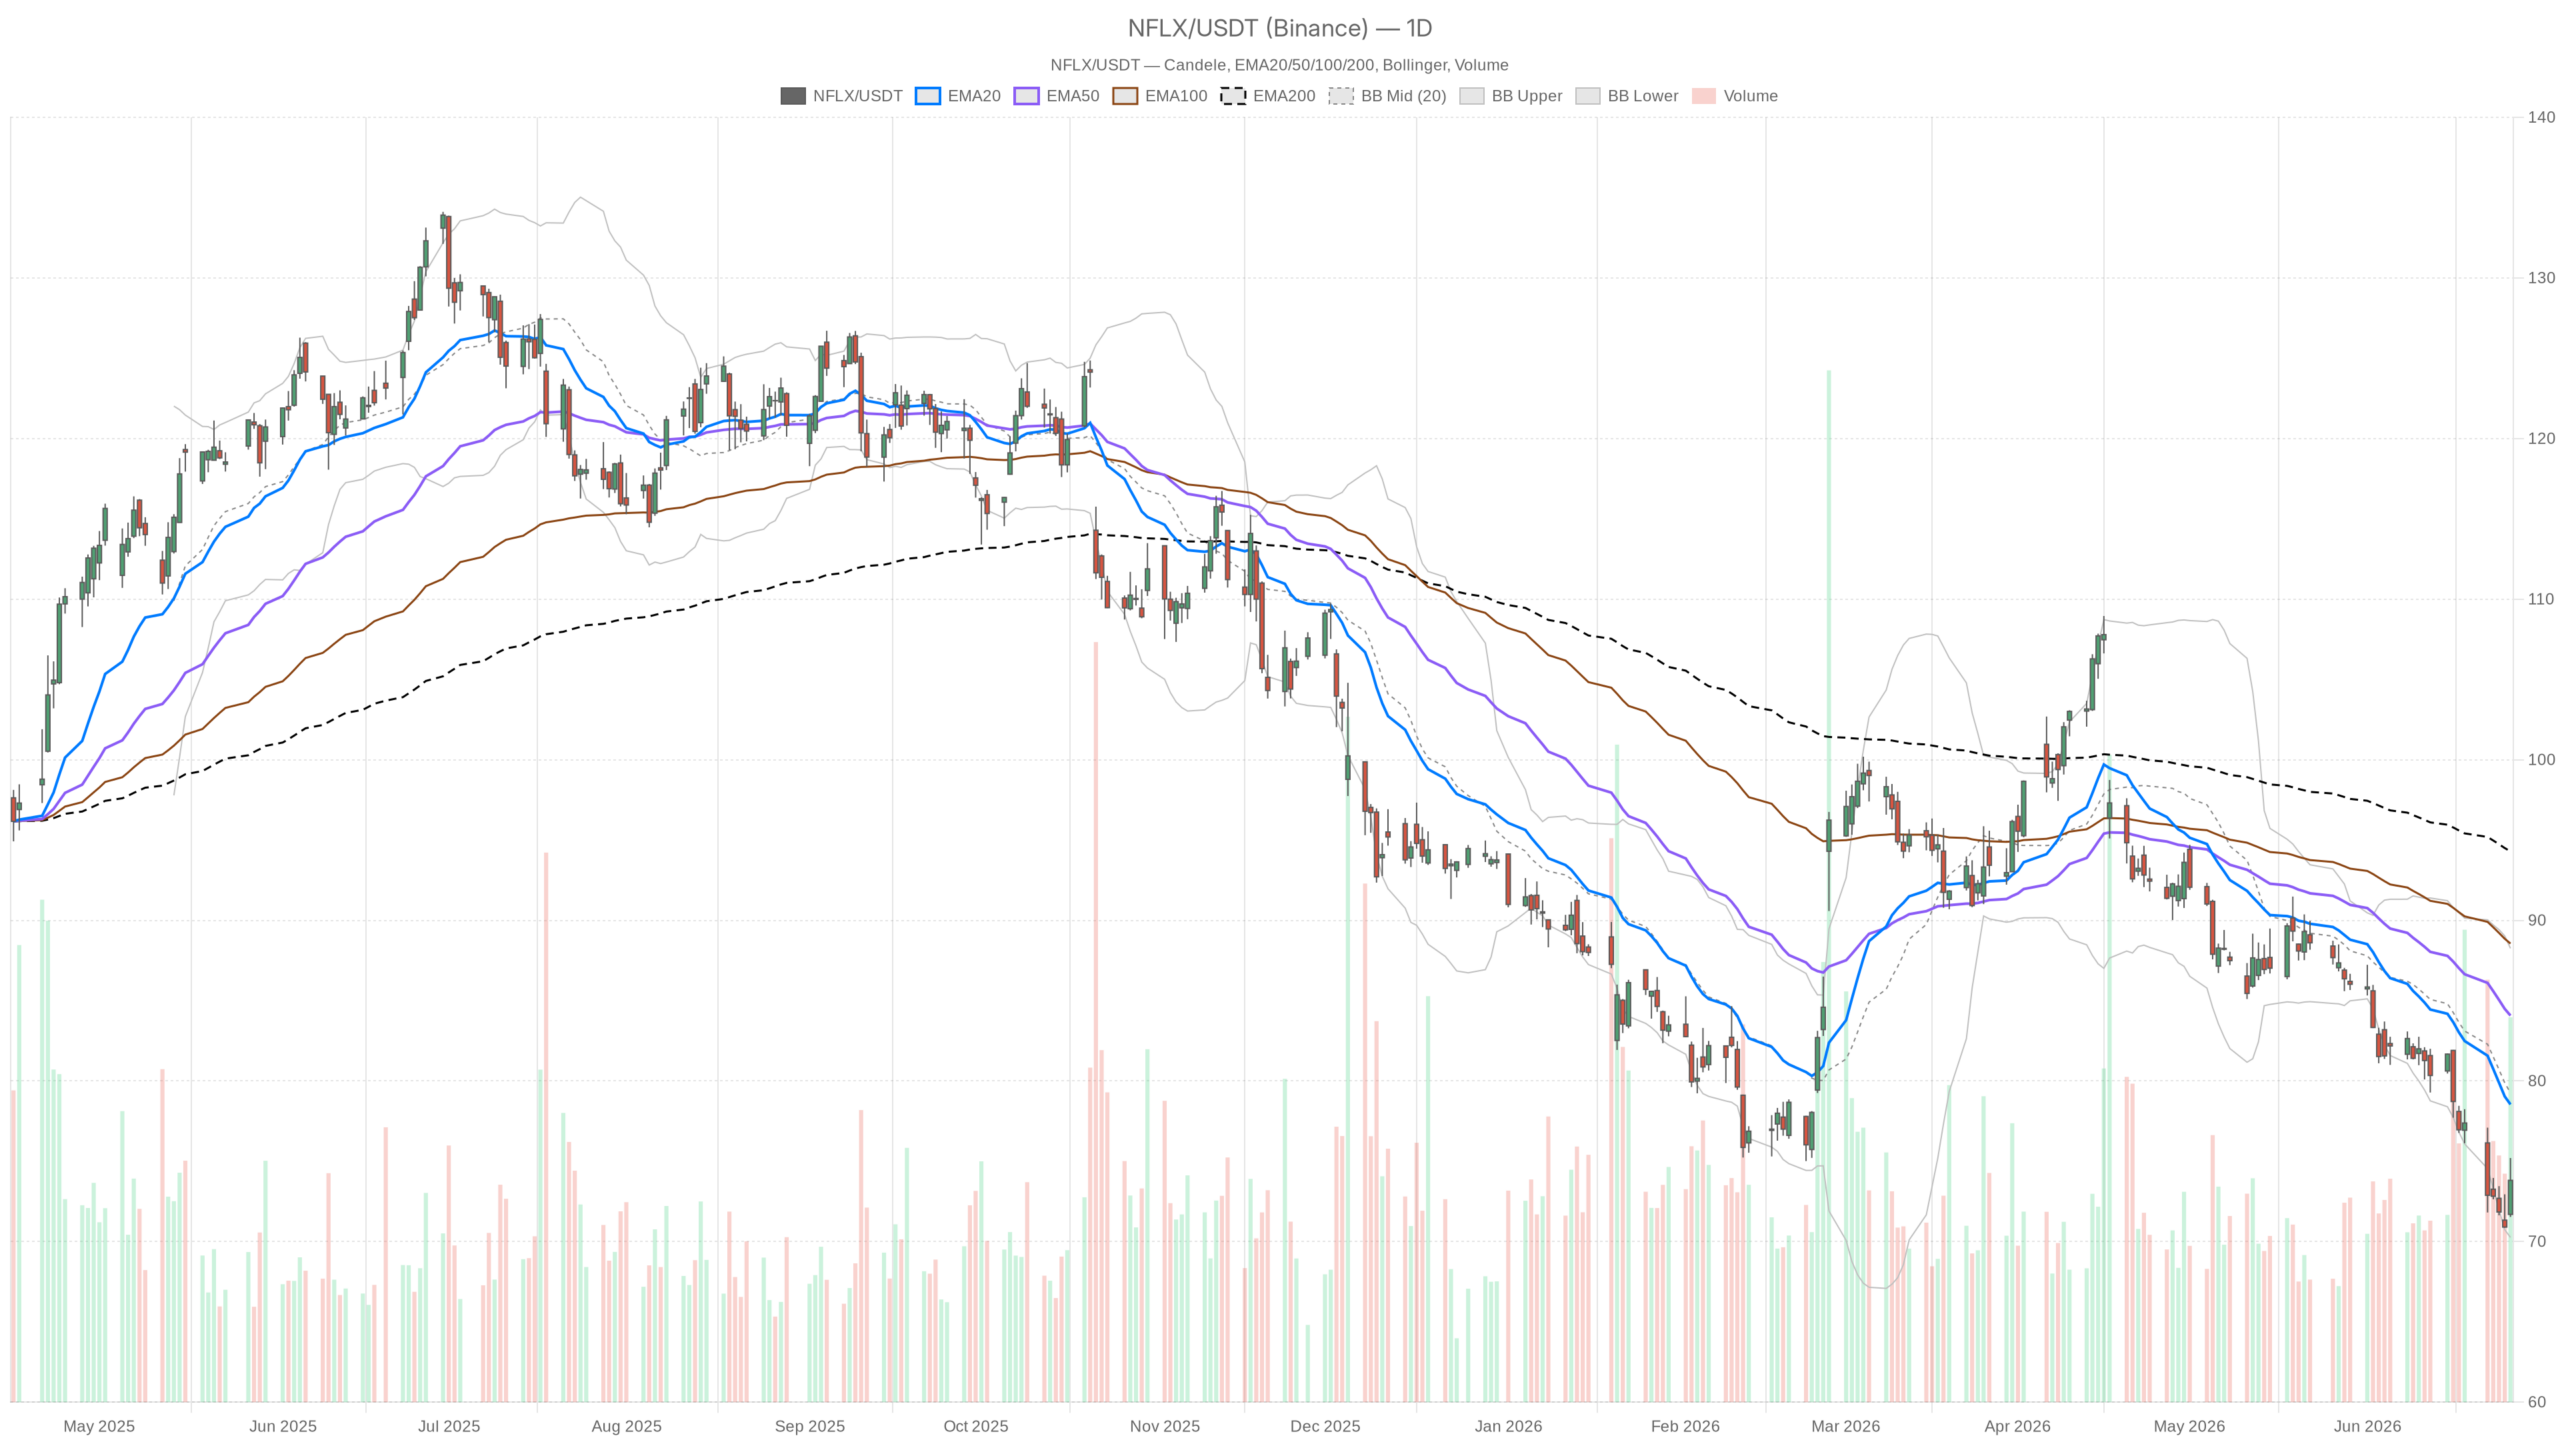 NFLX — daily chart with candlesticks, EMA20/EMA50 and volume.
Key takeaways
- NFLX closed at $73.81 on June 26, beneath the EMA20 ($78.54), EMA50 ($84.07), and EMA200 ($94.29) — a full bearish moving-average stack.
- Daily RSI at 31.53 signals exhaustion rather than reversal; oversold conditions can persist for weeks in a strong downtrend.
- The Omnicom AI-advertising deal drove a ~5.3% intraday bounce, but Netflix stock still failed to reclaim key technical resistance.
- Bullish case requires a sustained reclaim of the $79 Bollinger midline; until then, the burden of proof rests with buyers.
- A breakdown below $71.53–$71.83 support would open the door to fresh multi-year lows, with accelerated selling below $70.25.
Daily Chart Confirms Netflix Stock’s Bearish Regime
The daily chart confirms Netflix stock is in a structural bearish regime. Price closed at $73.81 on June 26, sitting beneath all three major moving averages. Specifically, the session range stretched from $71.53 to $75.20. The EMA20 sits at $78.54, the EMA50 at $84.07, and the EMA200 at $94.29. That full bearish stack signals a structural downtrend with no ambiguity. The trend is down across every meaningful horizon on the daily chart.
RSI Nears Oversold Without Signaling Reversal
The daily RSI at 31.53 is approaching oversold territory. However, this does not signal a reversal — it signals exhaustion. In a persistent downtrend, RSI can remain compressed for weeks. Still, it suggests sellers have dominated long enough that a short-term bounce or consolidation is plausible.
MACD and Bollinger Bands Deepen the Bearish Case
Meanwhile, the daily MACD reinforces the bearish picture. The MACD line sits at -4.02 against a signal line of -3.45, with a negative histogram of -0.57. Notably, the gap is widening rather than contracting. Momentum remains skewed to the downside, offering no early sign of a trend reversal developing from below.
Bollinger Bands show price hugging the lower band at $70.25. Netflix stock closed at $73.81, still well below the midline at $79.25. That midline acts as a key ceiling for any near-term recovery. A sustained move back above $79 would be the first meaningful sign of structural improvement. Without it, any upside remains a countertrend move within a broader decline.
Key Pivot Levels to Watch
Additionally, daily ATR sits at $2.45, giving a reasonable sense of expected daily range. Pivot analysis places key resistance at R1 near $75.50. The pivot point lands at $73.51, with support at S1 around $71.83. The stock closed just above its daily pivot, which is mildly constructive for the very short term. However, resistance at $75.50 is close. Breaking above it would require a meaningful shift in buying pressure.
The Omnicom Catalyst Behind NFLX’s Bounce
The June 26 bounce was driven by a concrete fundamental catalyst. Netflix stock surged roughly 5.3% after announcing an AI-powered advertising alliance with Omnicom Media Group. The deal leverages first-party viewer data for highly targeted ad delivery. This is a meaningful strategic move, speaking directly to monetizing Netflix’s massive subscriber base through an evolving ad-tech infrastructure. Overall, the market responded positively, though the stock still closed well short of its key technical resistance levels.
Hourly Chart Offers Contrasting Signals
The hourly chart offers a more nuanced picture than the daily, with the H1 regime reading neutral rather than bearish. Price at $73.63 sits above the hourly EMA20 at $73.33. However, it remains below the EMA50 at $74.58 and far below the EMA200 at $80.63.
At the same time, the hourly MACD histogram has flipped positive at +0.31. That is a modest but real sign of short-term buying momentum building. Meanwhile, RSI on the hourly stands at 51.13, sitting squarely in neutral ground after recovering from lower levels.
In contrast to the daily breakdown, the hourly chart suggests intraday buying pressure did emerge and is not entirely exhausted. However, the EMA50 at $74.58 and the Bollinger upper band at $74.97 together form a near-term resistance cluster. The hourly pivot R1 is also aligned around $74.10. That marks the first meaningful hurdle for any continuation higher. Breaking and holding above $74.10–$74.97 on the hourly would be required to suggest short-term momentum has turned constructively enough to challenge the daily pivot zone.
Analyst Sentiment and Shorter Timeframes
The 15-minute chart reflects compressed near-term volatility, while analyst sentiment on Netflix stock remains deeply divided following the recent selloff. The 15m regime is neutral, with RSI at 47.44 and a slightly negative MACD histogram at -0.14. Price drifts just below the 15m EMA20 at $73.89. The 15m EMA200 at $74.82 adds another layer of overhead. Therefore, the stock needs to reclaim the 15m Bollinger midline at $74.26 to maintain upside momentum even in the very short term. Overall, ATR on this frame is tight at $0.38, reflecting compressed near-term volatility following the morning’s sharp move.
From a news flow perspective, the analyst community remains split. Bernstein maintained a Buy rating with a $110 price target as recently as June 23. Citizens, however, reiterated a Market Perform — a notably cautious stance. Separately, a Seeking Alpha analysis highlighted the $25 billion buyback program, ad-tech margin gains, and generative AI efficiencies as genuine positives. However, it also flagged IP embargo risk, sports margin dilution, and moat erosion as credible headwinds. That balanced view mirrors the technical conflict between a structurally damaged daily chart and some genuine fundamental catalysts beginning to emerge.
Bullish and Bearish Scenarios for Netflix Stock
Netflix stock faces two distinct paths: a bullish base-building scenario requiring a reclaim of $79, or a bearish breakdown below the $71.53 support zone. The bullish case rests on a combination of factors. Notably, the Omnicom ad-tech deal signals real monetization progress. The $25B buyback provides a structural floor for the stock. If NFLX can clear the $75.50 daily R1 level and begin closing above the Bollinger midline near $79, that would signal the beginning of a genuine base-building process. Additionally, an RSI recovery toward 40–45 on the daily, alongside a MACD histogram turning less negative, would strengthen that case meaningfully.
On the other hand, the bearish scenario remains well-supported by the current data. Specifically, a failure to hold above the $71.53–$71.83 support zone — the daily low and S1 — would reopen downside toward fresh multi-year lows. The stock has already plunged roughly 45% from its peak, according to recent reporting. The full bearish EMA stack on the daily, combined with a widening negative MACD, suggests any recovery could easily stall. Therefore, a breakdown below the Bollinger lower band at $70.25 would confirm accelerated selling pressure.
Overall Assessment — Bears Still Control NFLX
Netflix stock remains a technically damaged name in a confirmed bearish regime. The burden of proof lies squarely with the bulls. Overall, the intraday and hourly readings have improved at the margin. The Omnicom news provided a real catalyst. However, that improvement has not yet registered in the daily structure. Volatility remains meaningful with a daily ATR near $2.45. The stock can swing sharply in either direction on any given session. Positioning here demands patience. Until NFLX reclaims the $79 Bollinger midline, any shift in primary bias cannot be justified.
FAQ
Is Netflix stock in a bearish trend?
Yes. NFLX is trading below its EMA20, EMA50, and EMA200 on the daily chart — a full bearish moving-average stack. The daily RSI near 31.53 and a widening negative MACD confirm the downtrend remains firmly intact.
What caused Netflix stock to bounce on June 26?
The bounce was driven by an announced AI-powered advertising alliance with Omnicom Media Group. The deal leverages first-party viewer data for targeted ad delivery, signaling meaningful monetization progress. However, Netflix stock still closed well short of key technical resistance levels.
What level does NFLX need to reclaim for a trend reversal?
A sustained move above the $79 Bollinger midline would be the first meaningful sign of structural improvement. Additionally, clearing the $75.50 daily R1 resistance is a necessary near-term step before any bullish case gains credibility.
What is the key support level for Netflix stock?
The $71.53–$71.83 support zone — the June 26 low and daily S1 pivot — is the immediate floor. A breakdown below this area would reopen downside risk toward multi-year lows, with the Bollinger lower band at $70.25 marking the next line of defense.
Disclaimer: This article is for informational purposes only and does not constitute financial advice, an investment recommendation, or a solicitation to buy or sell any financial instrument or cryptocurrency. The analysis provided is not indicative of future results. Investing in crypto assets and financial markets carries a high risk of capital loss. Always do your own research (DYOR) and consult a qualified financial advisor before making any decision.
Article produced with the assistance of artificial intelligence and reviewed by the editorial team.


You May Also Like

White House to speak with law enforcement groups to push Crypto's Clarity Act
Meta Restricts Engineers' Use of Claude Code And Codex Over Model 'Distillation' Concerns


