

Ethereum price prediction: Will ETH underperform Bitcoin again in 2026?
Ethereum has fallen harder than Bitcoin, down nearly 70% from its high while the ETH/BTC ratio sits near multi-year lows. Will Ether keep lagging the market leader through 2026, or is the underperformance setting up a reversal? Here is the case on both sides, and what would flip it.
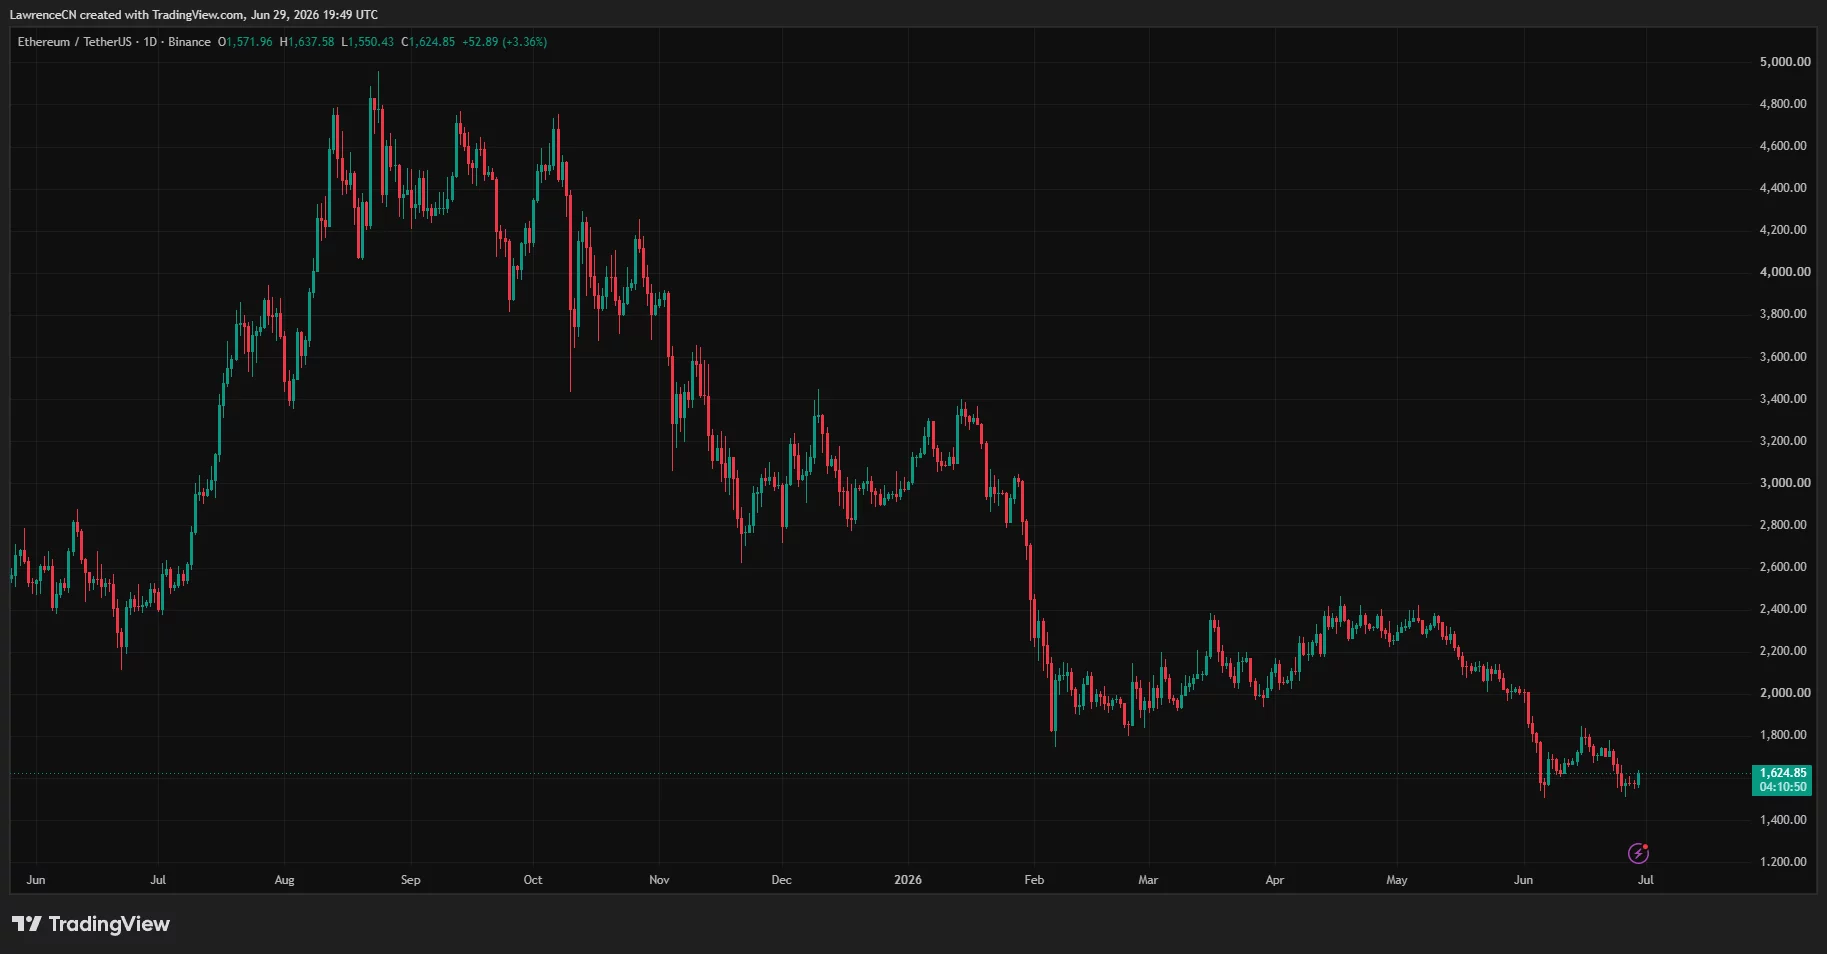
- Ethereum trades near $1,550 as of late June 2026, down roughly 68% from its August 2025 all-time high near $4,950 and below every major moving average, the weakest technical picture among the large-cap majors.
- The ETH/BTC ratio sits near multi-year lows because Ether has fallen harder than Bitcoin’s roughly 52% drawdown, extending a multi-year stretch of underperformance against the market leader.
- The case for continued underperformance rests on Bitcoin’s ETF and treasury-driven institutional dominance, competition from Solana for on-chain activity, and a muddier investment narrative for Ether.
- The case for a reversal rests on deep-value pricing, staking yield, the Layer-2 and tokenization ecosystem, potential rotation of ETF flows, and the tendency of Ether to outperform in late-cycle altcoin phases.
- Year-end forecasts span roughly $1,266 at the bearish end to $4,400 to $5,300 at the bullish end, a gap that turns on whether capital rotates back toward Ether or stays concentrated in Bitcoin.
Ethereum (ETH) is trading near $1,550 as of late June 2026, and it has fallen harder than almost any other large-cap crypto asset, which raises the question this article addresses: will Ether keep underperforming Bitcoin through the rest of 2026, or is the very depth of its decline setting up a reversal?
The numbers frame the problem starkly. Ether is down roughly 68% from its August 2025 all-time high near $4,950, a far deeper drawdown than Bitcoin’s roughly 52% fall from its own peak, and it trades below every major moving average, from the 20-day exponential average on up through the 200-day near $2,317, with a completed death cross and a relative strength index near 30.
The Fear and Greed reading sits around 13, even deeper in extreme fear than Bitcoin’s, and the $1,500 to $1,600 zone has become the line in the sand that bulls are defending; a clean loss of it opens $1,450 and then $1,400. Most tellingly for this question, the ratio of Ether’s price to Bitcoin’s sits near multi-year lows, the clearest single expression of how badly Ether has lagged the asset the market treats as its anchor.
That ratio, ETH measured against BTC, is the real subject of this piece, because the question is not only where Ether’s dollar price goes but whether it keeps losing ground to Bitcoin specifically. This article works through it from both directions: where Ethereum stands technically, what the ETH/BTC ratio actually measures and why it matters, the structural reasons Ether has underperformed, the case that the underperformance continues, the case that it reverses, what the analysts forecast, the specific conditions that would flip the ratio one way or the other, and three scenarios for both the ratio and the absolute price into year-end. The aim is to give a fair hearing to both sides, because this is a genuinely contested question on which thoughtful people disagree.
The forecasts here are information, not advice. And the framing to carry throughout is that Ether’s 2026 outcome has 2 layers: its dollar price, which depends heavily on the broad market, and its performance relative to Bitcoin, which depends on whether capital rotates back toward Ether or stays concentrated in the market leader. Both layers point to the same underlying question of whether Ethereum can reclaim the narrative momentum it has lost.
Where Ethereum stands right now
The technical condition of Ethereum is the weakest among the large-cap majors, and being honest about that is the starting point. Near $1,550, Ether trades below its 20-day, 50-day, 100-day, and 200-day exponential moving averages, the last of which sits up near $2,317, meaning price is far beneath even its slowest-moving trend line. A death cross, the bearish crossover of shorter and longer averages, has completed, confirming the downtrend on the technical framework many traders use.
The relative strength index near 30 indicates oversold conditions and weak buying momentum, and the broader structure since the spring has been one of lower highs and lower lows, with sellers in control through a steep decline from the $2,000-plus range earlier in the year down to the current zone. The $1,500 to $1,600 area is the critical support, having acted as the 2026 floor, and below it the next levels are $1,450 and $1,400.
Sentiment is correspondingly grim. The Fear and Greed reading around 13 is a deeper extreme fear than Bitcoin’s, reflecting how thoroughly the market has soured on Ether specifically. The drawdown of roughly 68% from the August 2025 high near $4,950 is severe even by crypto standards and significantly worse than Bitcoin’s contemporaneous decline, which is the heart of the underperformance story. To improve the picture,
Ether needs, at minimum, to reclaim short-term resistance near $1,700 to $1,750, and a genuine trend change would require recovering the higher averages up toward $2,000 and then $2,317. Until then, the structure is bearish, and the burden of proof sits with buyers.
This is the uncomfortable backdrop against which the underperformance question must be answered: Ether is not merely down; it is down harder than Bitcoin, deeper in fear, and weaker on the charts, which is exactly why some see capitulation and opportunity while others see a structurally lagging asset with further to fall.
What the ETH/BTC ratio is telling us
To analyze underperformance properly, you have to understand the ETH/BTC ratio, because it strips out the broad market and isolates the question of Ether versus Bitcoin specifically. The ratio simply expresses Ether’s price in terms of Bitcoin rather than dollars, and it rises when Ether outperforms Bitcoin and falls when Ether lags. Right now it sits near multi-year lows, which is the precise, quantified statement of the problem: over an extended period, and especially through the 2025 to 2026 drawdown, Ether has lost value against Bitcoin, not just against the dollar. When both assets fall, but one falls more, the ratio captures the difference, and Ether’s roughly 68% drawdown against Bitcoin’s roughly 52% means Ether has shed a meaningful chunk of its value relative to the market leader.
Why does this matter beyond bookkeeping? The ETH/BTC ratio is one of the most-watched gauges in crypto because it functions as a barometer of risk appetite and capital rotation within the asset class. When the ratio rises, it typically signals that capital is rotating out of Bitcoin and into Ether and the broader altcoin complex, the classic risk-on, altcoin-season dynamic. When it falls, as now, it signals that capital is concentrating in Bitcoin, treating it as the safer, more institutionally endorsed crypto asset while shunning the higher-beta alternatives.
A ratio near multi-year lows therefore tells a story: the market, in its current risk-off and Bitcoin-dominated mood, has been choosing Bitcoin over Ether decisively. For the question of whether Ether underperforms again in 2026, the ratio is both the scoreboard and the leading indicator.
A continued decline or stagnation in the ratio means underperformance persists; a sustained turn upward would be the clearest sign that Ether is regaining ground. Everything that follows, the structural arguments and the catalysts, ultimately expresses itself through which way this ratio moves.
Why Ethereum has underperformed
Understanding the causes of Ether’s underperformance is essential to judging whether it continues, and several structural forces have converged against it. The 1st and arguably most important is the institutional bid for Bitcoin that Ether has not matched in kind.
Spot Bitcoin ETFs and a wave of corporate Bitcoin treasuries have created sustained, price-insensitive demand that treats Bitcoin as digital gold and a primary reserve asset, a role with no clear Ether equivalent. While Ether has its own ETFs, the institutional narrative around Bitcoin as a macro reserve asset has been far more powerful, channeling the bulk of institutional crypto allocation toward Bitcoin and leaving Ether to compete for a smaller, more speculative pool of capital. In a risk-off market, that distinction is decisive: capital flows to the asset with the strongest institutional endorsement, which has been Bitcoin.
The 2nd force is competition for Ethereum’s core use case. Solana and other high-throughput chains have captured a large share of the on-chain activity, particularly the memecoin and high-frequency trading culture, that once would have flowed to Ethereum, challenging Ether’s status as the default smart-contract platform and muddying its growth narrative.
The 3rd is a narrative problem of Ether’s own. Following its technical upgrades, the relationship between network activity and value accrual to the token has become more complicated, with much activity migrating to Layer-2 networks whose fees do not always translate cleanly into demand for Ether, leaving the investment case harder to articulate than Bitcoin’s simple scarcity story.
Together, these forces- Bitcoin’s institutional dominance, Solana’s competitive pressure, and a muddier value-accrual narrative- explain why capital has favored Bitcoin and why the ETH/BTC ratio has fallen to multi-year lows. They are real and structural, not merely cyclical, which is what gives the continued-underperformance thesis its force.
The case that the underperformance continues
The bearish-on-ratio case holds that the forces just described are durable and that Ether keeps lagging Bitcoin through 2026. Its strongest pillar is that the institutional preference for Bitcoin is structural rather than temporary. As long as the dominant institutional narrative casts Bitcoin as the crypto reserve asset and digital gold, with ETFs and treasuries channeling allocation toward it, Ether will struggle to attract a comparable bid, and in any risk-off phase capital will continue concentrating in Bitcoin.
This is not a sentiment that flips quickly; it reflects how large allocators have categorized the two assets, and that categorization has only deepened through the current drawdown. On this view, the ETH/BTC ratio at multi-year lows is not an anomaly poised to mean-revert but the accurate reflection of a lasting shift in how the market values the two.
The competitive and narrative pillars reinforce the case. If Solana and other chains continue to capture on-chain activity and developer attention, Ethereum’s growth story weakens further, and a weakening fundamental narrative makes it harder for Ether to outperform regardless of price level. The muddled value-accrual picture, with activity on Layer-2 networks not cleanly driving Ether demand, means that even genuine ecosystem growth may not translate into the token appreciation that would lift the ratio. Bears also note that Ether’s deeper drawdown is itself a warning: an asset that falls harder than the market leader in a downturn is displaying higher beta and weaker relative strength, traits that tend to persist until a clear catalyst changes them.
In this reading, the most likely path for 2026 is that Ether’s dollar price may rise or fall with the broad market, but it continues to underperform Bitcoin specifically, with the ratio grinding sideways to lower, because none of the structural forces working against it have meaningfully reversed. The underperformance, on this thesis, is a feature of the current market regime, not a temporary dislocation.
The case for a reversal
The bullish-on-ratio case is equally serious and rests on the proposition that Ether’s underperformance has gone far enough to create the conditions for its own reversal. The 1st pillar is deep value. After a 68% drawdown that has driven Ether to multi-year lows against Bitcoin and into extreme fear, the bull argument is that the selling has been overdone, that much of the bad news, the competition, the narrative confusion, the risk-off flight to Bitcoin, is now priced in, and that assets this oversold relative to the leader have historically offered strong mean-reversion potential when sentiment turns.
The 2nd pillar is Ether’s genuine fundamental base, which remains the deepest in the smart-contract world: it anchors the largest decentralized finance ecosystem, hosts the bulk of tokenized real-world asset activity, supports a sprawling Layer-2 network of scaling solutions, and offers a staking yield that gives holders a return Bitcoin does not. These are real assets that a reversal thesis can build on.
The 3rd pillar is the potential for capital rotation, which is how ratio reversals historically happen. In past cycles, after Bitcoin leads a move and its dominance peaks, capital has frequently rotated into Ether and the broader altcoin complex in a late-cycle altcoin season that drives the ETH/BTC ratio sharply higher, and bulls argue the current extreme in Bitcoin dominance and Ether weakness is exactly the kind of setup that precedes such a rotation.
Specific catalysts could trigger it: ETF flows rotating from Bitcoin toward Ether, particularly if Ether ETF staking features attract yield-seeking institutional capital; a stumble in Solana’s momentum that returns activity and attention to Ethereum; a broad macro shift to risk-on that lifts the higher-beta assets most; and the growth of tokenization and institutional finance building on Ethereum translating into clearer token demand.
On this view, the very severity of Ether’s underperformance, the multi-year-low ratio and the extreme fear, is the contrarian signal, and 2026 could be the year the ratio turns as capital rotates back toward a deeply discounted asset with the strongest fundamental ecosystem in its category. The reversal is not guaranteed, but it is a coherent thesis grounded in real catalysts and historical precedent.
What the analysts forecast
The analyst forecasts for Ether’s dollar price in 2026 span a wide range that maps onto the underperformance debate. On the bearish side, model-driven and cautious forecasters see continued weakness: Traders Union’s statistical model projects a year-end average near $1,266, and DigitalCoinPrice has pointed to a 4th-quarter low around $1,370, both implying Ether stays near or below current levels and, by extension, likely keeps underperforming a Bitcoin that most forecasters see holding higher absolute levels. These bearish targets are consistent with the thesis that the structural forces against Ether persist and that the ratio does not recover.
On the bullish side, forecasters such as BitScreener have projected Ether reaching toward $4,676 by year-end, and others, including Cryptopolitan and the optimistic scenarios at LiteFinance, point to ranges of roughly $4,400 to $5,300, which would imply a powerful recovery and, if Bitcoin does not rise proportionally, a sharp improvement in the ETH/BTC ratio.
The gap between roughly $1,266 and $5,300 for the same asset in the same year is enormous, and like Bitcoin and XRP, it reflects genuine uncertainty rather than careless modeling. The bearish numbers assume the structural underperformance continues and Ether stays pinned near its lows; the bullish numbers assume a reversal driven by rotation, deep-value mean reversion, and Ether’s fundamental strengths reasserting themselves.
What the forecasts collectively reveal is that Ether’s 2026 outcome is even more binary than Bitcoin’s, because it depends not only on the direction of the broad market but on whether capital rotates back toward Ether specifically. An investor who believes the rotation comes will lean toward the high forecasts; one who believes Bitcoin’s dominance is structural will lean toward the low ones.
The forecasts cannot settle the debate; they can only show how much rides on it. For the underperformance question specifically, the spread is a reminder that Ether is the higher-variance bet, capable of both deeper losses and sharper recoveries than the market leader, which is precisely the profile of an asset whose relative performance is genuinely up for grabs.
What would flip the ratio, and what would keep it down
The underperformance question ultimately resolves into a set of watchable conditions, and naming them is more useful than guessing. The ratio would flip in Ether’s favor on several developments. The clearest would be a broad rotation into altcoins, the classic late-cycle dynamic in which Bitcoin dominance peaks and capital flows down the risk curve into Ether first; a sustained turn upward in the ETH/BTC ratio off its multi-year lows would be the signal that this is underway. ETF flows rotating toward Ether, especially if staking-enabled Ether products draw yield-seeking institutional capital, would provide a concrete demand catalyst.
A stumble in Solana’s momentum that returns on-chain activity and developer attention to Ethereum would repair the competitive narrative. A macro shift to risk-on, with the Federal Reserve easing and liquidity improving, would favor the higher-beta asset, which is Ether. And technically, reclaiming resistance near $1,700 to $1,750 and then the higher averages toward $2,000 and $2,317 would confirm a trend change. If these align, the reversal thesis gains the upper hand.
The conditions that keep Ether underperforming are the mirror image. Continued institutional concentration in Bitcoin, with ETFs and treasuries channeling allocation toward the market leader and away from Ether, would preserve the structural imbalance. Ongoing Solana strength and further erosion of Ethereum’s on-chain dominance would keep the fundamental narrative weak.
A persistent risk-off market would keep capital huddled in Bitcoin instead of rotating into higher-beta Ether. And technically, a loss of the $1,500 support that opens $1,450 and $1,400 would confirm that sellers remain in control and that the ratio is still falling. The practical discipline for anyone watching this question is to track the ETH/BTC ratio directly as the scoreboard, alongside Bitcoin dominance, ETF flow data, Solana’s activity trends, and the macro backdrop. Those signals will reveal whether 2026 is another year of Ether lagging the leader or the year the long underperformance finally reverses. The market will answer the question through the ratio; the job is to watch it instead of to assume.
Three scenarios for Ethereum in 2026
Translating the debate into scenarios captures both the dollar price and the relative-performance dimension. In the bull scenario, the underperformance reverses. Capital rotates into Ether in a late-cycle altcoin phase, ETF flows and staking demand pick up, Solana’s momentum cools, the macro turns risk-on, and Ether recovers toward the $4,400 to $5,300 range that the optimistic forecasts describe, with the ETH/BTC ratio turning sharply higher off its multi-year lows.
In this world, Ether not only rises in dollar terms but decisively outperforms Bitcoin, rewarding the deep-value and rotation thesis. It is a coherent path, grounded in historical precedent and real catalysts, but it requires the structural forces that have favored Bitcoin to loosen.
In the base scenario, Ether broadly tracks the market without a clean resolution of the underperformance question. It stabilizes around current levels, recovers modestly if the broad market does, but continues to lag Bitcoin or merely matches it, with the ETH/BTC ratio grinding sideways near its lows instead of reversing decisively. Ether’s dollar price spends 2026 in a wide, volatile band, and the relative-performance question stays unresolved into 2027. This middle path reflects how balanced the structural arguments are and is a reasonable central expectation. In the bear scenario, the underperformance deepens.
Bitcoin’s institutional dominance persists, Solana continues to pressure Ethereum, the market stays risk-off, Ether loses the $1,500 support and slides toward $1,400 and below, validating the bearish forecasts near $1,266, and the ETH/BTC ratio falls further as capital keeps choosing Bitcoin. Which scenario unfolds depends on capital rotation, ETF flows, the Solana competition, and the macro backdrop, all of which express themselves through the ETH/BTC ratio. All 3 are live, and the breadth between them is exactly why Ether is the higher-variance bet among the majors heading into the rest of 2026.
Frequently Asked Questions
Will Ethereum underperform Bitcoin in 2026?
It is truly contested. Ether has underperformed Bitcoin badly, down roughly 68% from its 2025 high versus Bitcoin’s roughly 52%, pushing the ETH/BTC ratio to multi-year lows. The case for continued underperformance rests on Bitcoin’s structural institutional dominance through ETFs and treasuries, competition from Solana for on-chain activity, and a muddier value-accrual narrative for Ether. The case for a reversal rests on deep-value pricing after the severe drawdown, Ether’s strong fundamental ecosystem and staking yield, and the potential for capital to rotate into Ether in a late-cycle altcoin phase. The deciding signal is the ETH/BTC ratio itself; a sustained turn higher would mark a reversal, while continued weakness would confirm more underperformance.
Why has Ethereum fallen harder than Bitcoin?
Several structural forces have weighed on Ether more than Bitcoin. The biggest is the institutional bid for Bitcoin as digital gold and a reserve asset, channeled through ETFs and corporate treasuries, with no equally powerful equivalent for Ether. Competition from Solana and other high-throughput chains has captured on-chain activity that once flowed to Ethereum, weakening its growth narrative. And Ether’s value-accrual story has grown more complicated, with much activity migrating to Layer-2 networks whose fees do not cleanly translate into demand for the token. In a risk-off market, capital concentrates in the asset with the strongest institutional endorsement, which has been Bitcoin, leaving higher-beta Ether to fall harder.
What is the ETH/BTC ratio and why does it matter?
The ETH/BTC ratio expresses Ether’s price in terms of Bitcoin instead of dollars; it rises when Ether outperforms Bitcoin and falls when Ether lags. It matters because it strips out the broad market and isolates the question of Ether versus Bitcoin specifically, and because it functions as a barometer of risk appetite and capital rotation within crypto. A rising ratio typically signals capital rotating out of Bitcoin into Ether and altcoins, the classic altcoin-season dynamic; a falling ratio, as now near multi-year lows, signals capital concentrating in Bitcoin. For the underperformance question, the ratio is both the scoreboard and the leading indicator, so watching it directly is the best way to judge whether Ether is regaining or losing ground.
What would make Ethereum outperform again?
A reversal would likely require capital rotation into Ether, the late-cycle dynamic in which Bitcoin dominance peaks and money flows into Ether and altcoins, signaled by the ETH/BTC ratio turning up off its lows. Concrete catalysts include ETF flows rotating toward Ether, especially staking-enabled products attracting yield-seeking capital; a stumble in Solana’s momentum returning activity to Ethereum; a macro shift to risk-on that favors higher-beta assets; and Ether reclaiming technical resistance near $1,700 to $1,750 and then the higher averages toward $2,000 and $2,317. The bull thesis also leans on deep value after the 68% drawdown and Ether’s strong fundamentals in decentralized finance, tokenization, Layer-2s, and staking. If these align, the long underperformance could reverse in 2026.
What are analysts forecasting for Ethereum in 2026?
The range is very wide. Bearish, model-driven forecasts see continued weakness, with Traders Union projecting a year-end average near $1,266 and DigitalCoinPrice pointing to a 4th-quarter low around $1,370, implying Ether stays near its lows. Bullish forecasts are far higher, with BitScreener toward $4,676 and others, including Cryptopolitan and optimistic scenarios at LiteFinance, in the $4,400 to $5,300 range, implying a strong recovery. The gap from roughly $1,266 to $5,300 reflects genuine uncertainty: the low end assumes structural underperformance continues, while the high end assumes a reversal driven by rotation and deep-value mean reversion. Ether’s outcome is more binary than Bitcoin’s because it depends on whether capital rotates back toward Ether specifically.
Is Ethereum a better buy than Bitcoin right now?
This article does not give buy recommendations, and the honest answer is that it depends entirely on the question it examines. Ether offers higher potential reward if the underperformance reverses, because it is more deeply discounted and has more room to mean-revert, but it carries higher risk because the structural forces favoring Bitcoin- institutional dominance, Solana competition, and a muddier narrative- may persist. Bitcoin has been the safer, more institutionally endorsed asset that capital has favored in the risk-off market. Choosing between them is really a bet on whether capital rotates back toward Ether in 2026 or stays concentrated in Bitcoin, which is the unresolved question at the center of this analysis. Both are highly volatile and can lose value.
This article is information, not financial or investment advice. Ethereum and Bitcoin price levels, the ETH/BTC ratio, indicator readings, and analyst forecasts reflect data available as of June 28, 2026, are point-in-time, and can change rapidly. Cryptocurrency is highly volatile, and you can lose money. Price predictions are inherently uncertain, and the scenarios described are not guarantees. Do your own research and consult a qualified financial professional before making any investment decision.


You May Also Like

CNN's Abby Phillip trips up GOP insider Scott Jennings with his own Iran words

Eltropy Named to Inc. Regionals Pacific 2026 List of Fastest-Growing Private Companies


