Ethereum (ETH) Price: ETH Has Been Stuck for a Month — Here’s What Finally Breaks the Stalemate
TLDR
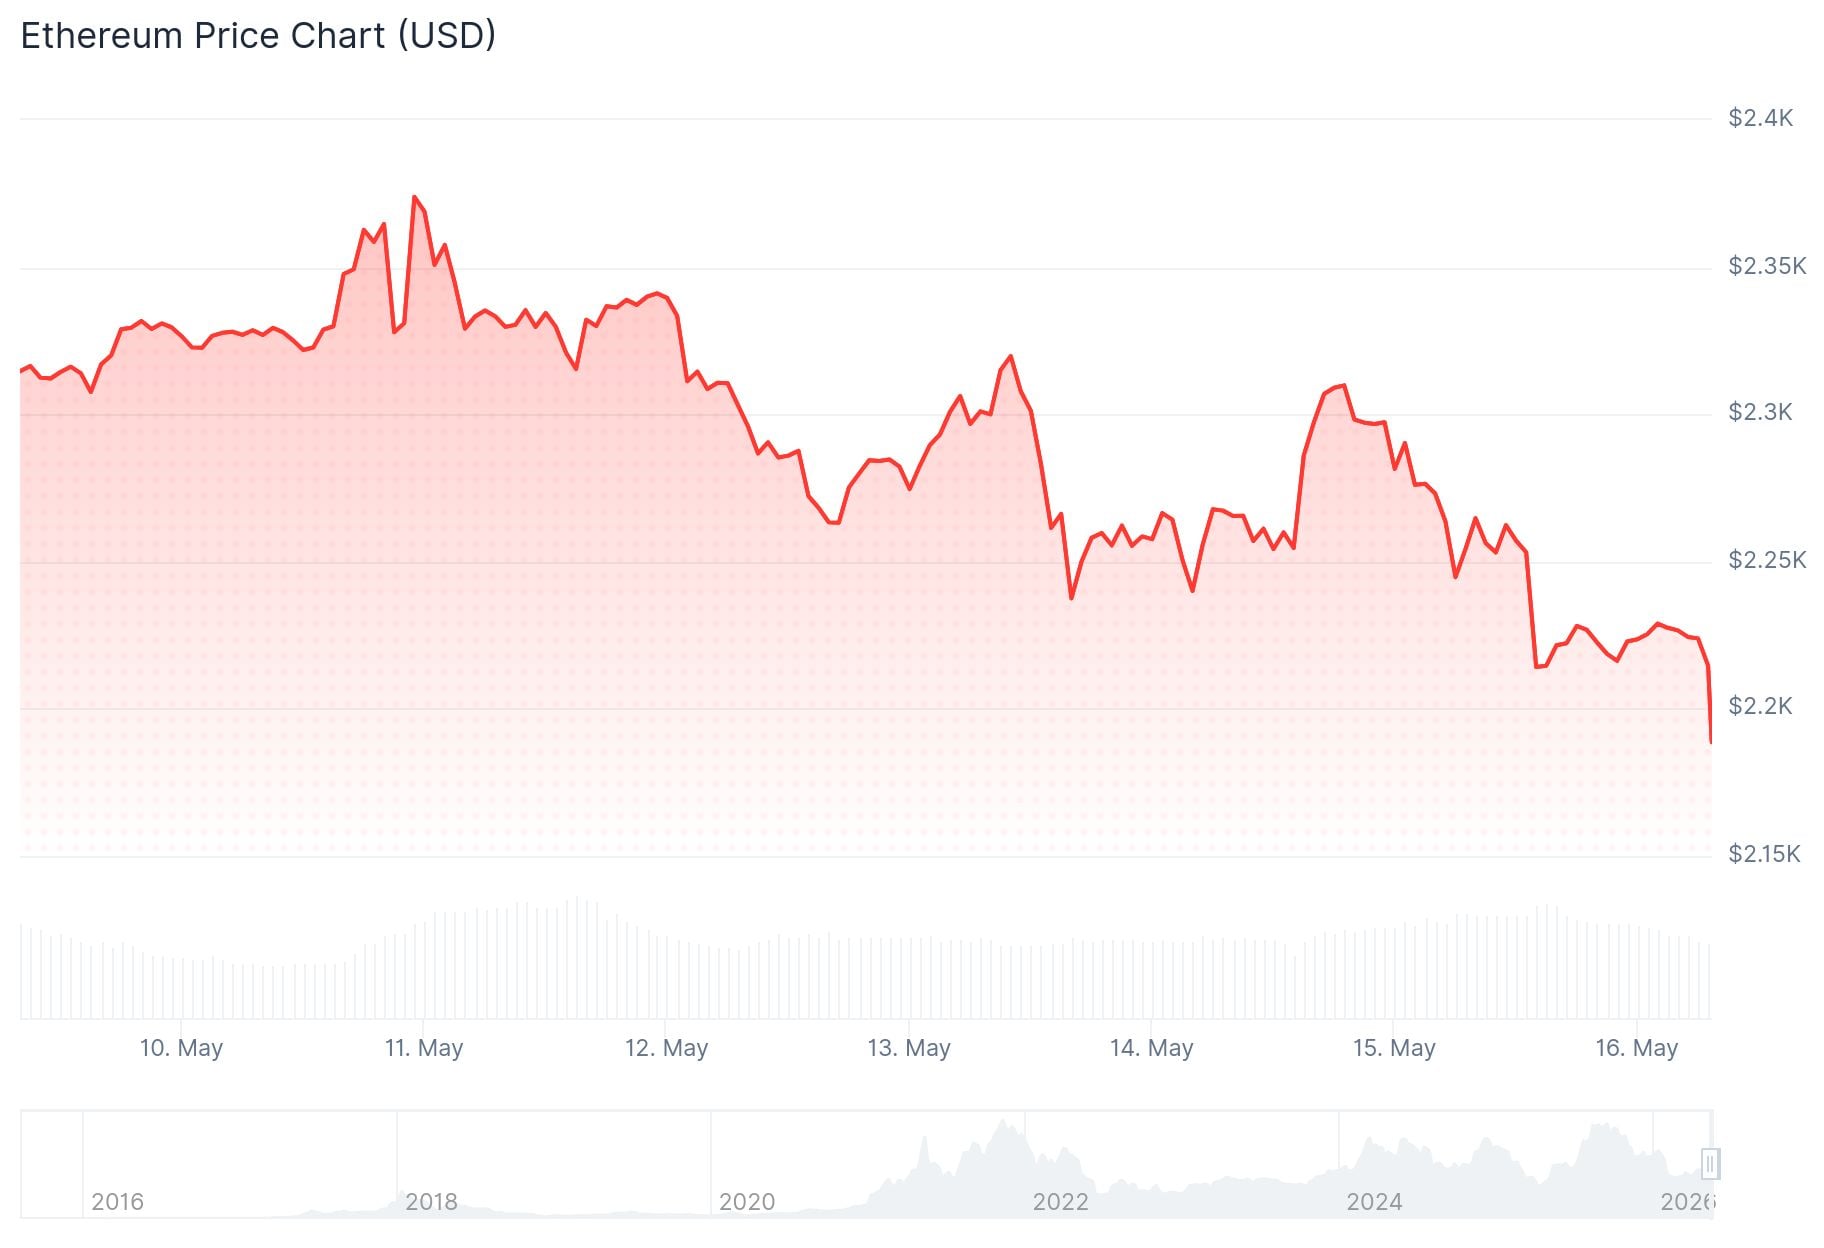
- ETH is trading around $2,226–$2,263, down roughly 3.74–5.5% over recent days.
- RSI has dropped below 50 and MACD is negative, pointing to weakening short-term momentum.
- Analyst Ali Charts posted that $1,071 looks like a strong buy zone at the bottom of the channel.
- ETH has been rangebound between $2,250 and $2,380 for nearly a month; a breakout either way could trigger a 10%+ move.
- Long-term targets from analyst Crypto Patel sit at $5,000, $10,000, and $15,000, with an accumulation zone between $1,500–$2,000.
Ethereum is facing selling pressure in the short term as momentum indicators weaken across the board. The price has pulled back roughly 3.74% in the past 24 hours and is hovering around $2,226–$2,263, according to CoinMarketCap.
 Ethereum (ETH) Price
Trader Symba noted that ETH has already started reacting from its recent range and suggested that if global equity markets, particularly the S&P 500, continue showing strength, both Bitcoin and Ethereum could follow. His chart showed ETH breaking above a short-term descending trendline after holding support near the lower boundary of its range.
Analyst Ace highlighted that buyers stepped in after a sweep of the $2,241.73 lows. Price then pushed into a $2,306.87 liquidity zone, where heavy demand was absorbed before ETH moved higher. Support is now sitting around $2,240–$2,250.
On-chain data from Santiment added a useful layer. ETH recorded its highest network realized profits in three weeks, totaling around $74.58 million, even as the price fell roughly 5.5% over three days. Santiment noted the selling likely came from older holders with a low cost basis, not from panic.
Technicals Signal Caution
The RSI has fallen to 43.22, breaking below the 50 level. The MACD line sits at -13.71, below its signal line of 0.52, and the histogram has turned red. Both indicators point to fading buying interest and a possible test of the 100-day moving average near $2,145.
Analyst Crypto Patel referenced the Ethereum rainbow chart, stating that ETH is currently sitting in what he calls a “cheap zone,” a level that has historically appeared only a few times before prices moved toward the “take profit” range. His accumulation zone is $1,500–$2,000, with long-term price targets at $5,000, $10,000, and $15,000.
Analyst Ali Charts took a more bearish near-term view, posting on X that $1,071 at the bottom of the channel looks like a strong area to buy ETH.
The Range That Defines the Next Move
Analyst Daan Crypto Trades framed the current structure clearly. Ethereum has been stuck between $2,250 and $2,380 for nearly a month, with buyers defending the lower band and sellers capping the upper end repeatedly.
A clean break above $2,380–$2,400 would shift momentum in favor of buyers, opening a potential move toward $2,500 and the $2,640 CME gap region. A break below $2,250 would give sellers control and could lead to deeper consolidation.
The 24-hour trading volume stands at $33.17 billion, with a market cap of $268.45 billion.
The post Ethereum (ETH) Price: ETH Has Been Stuck for a Month — Here’s What Finally Breaks the Stalemate appeared first on CoinCentral.


You May Also Like

Atlanta Service Provides Chemical-Free Lice Treatment for Vulnerable Populations

Could XRP Rise as 25% of Institutions Add XRP While Pepeto Presale Climbs