

Ethereum (ETH) Price Approaches Critical Support Zone — Technical Analysis Shows What’s Next
Key Points
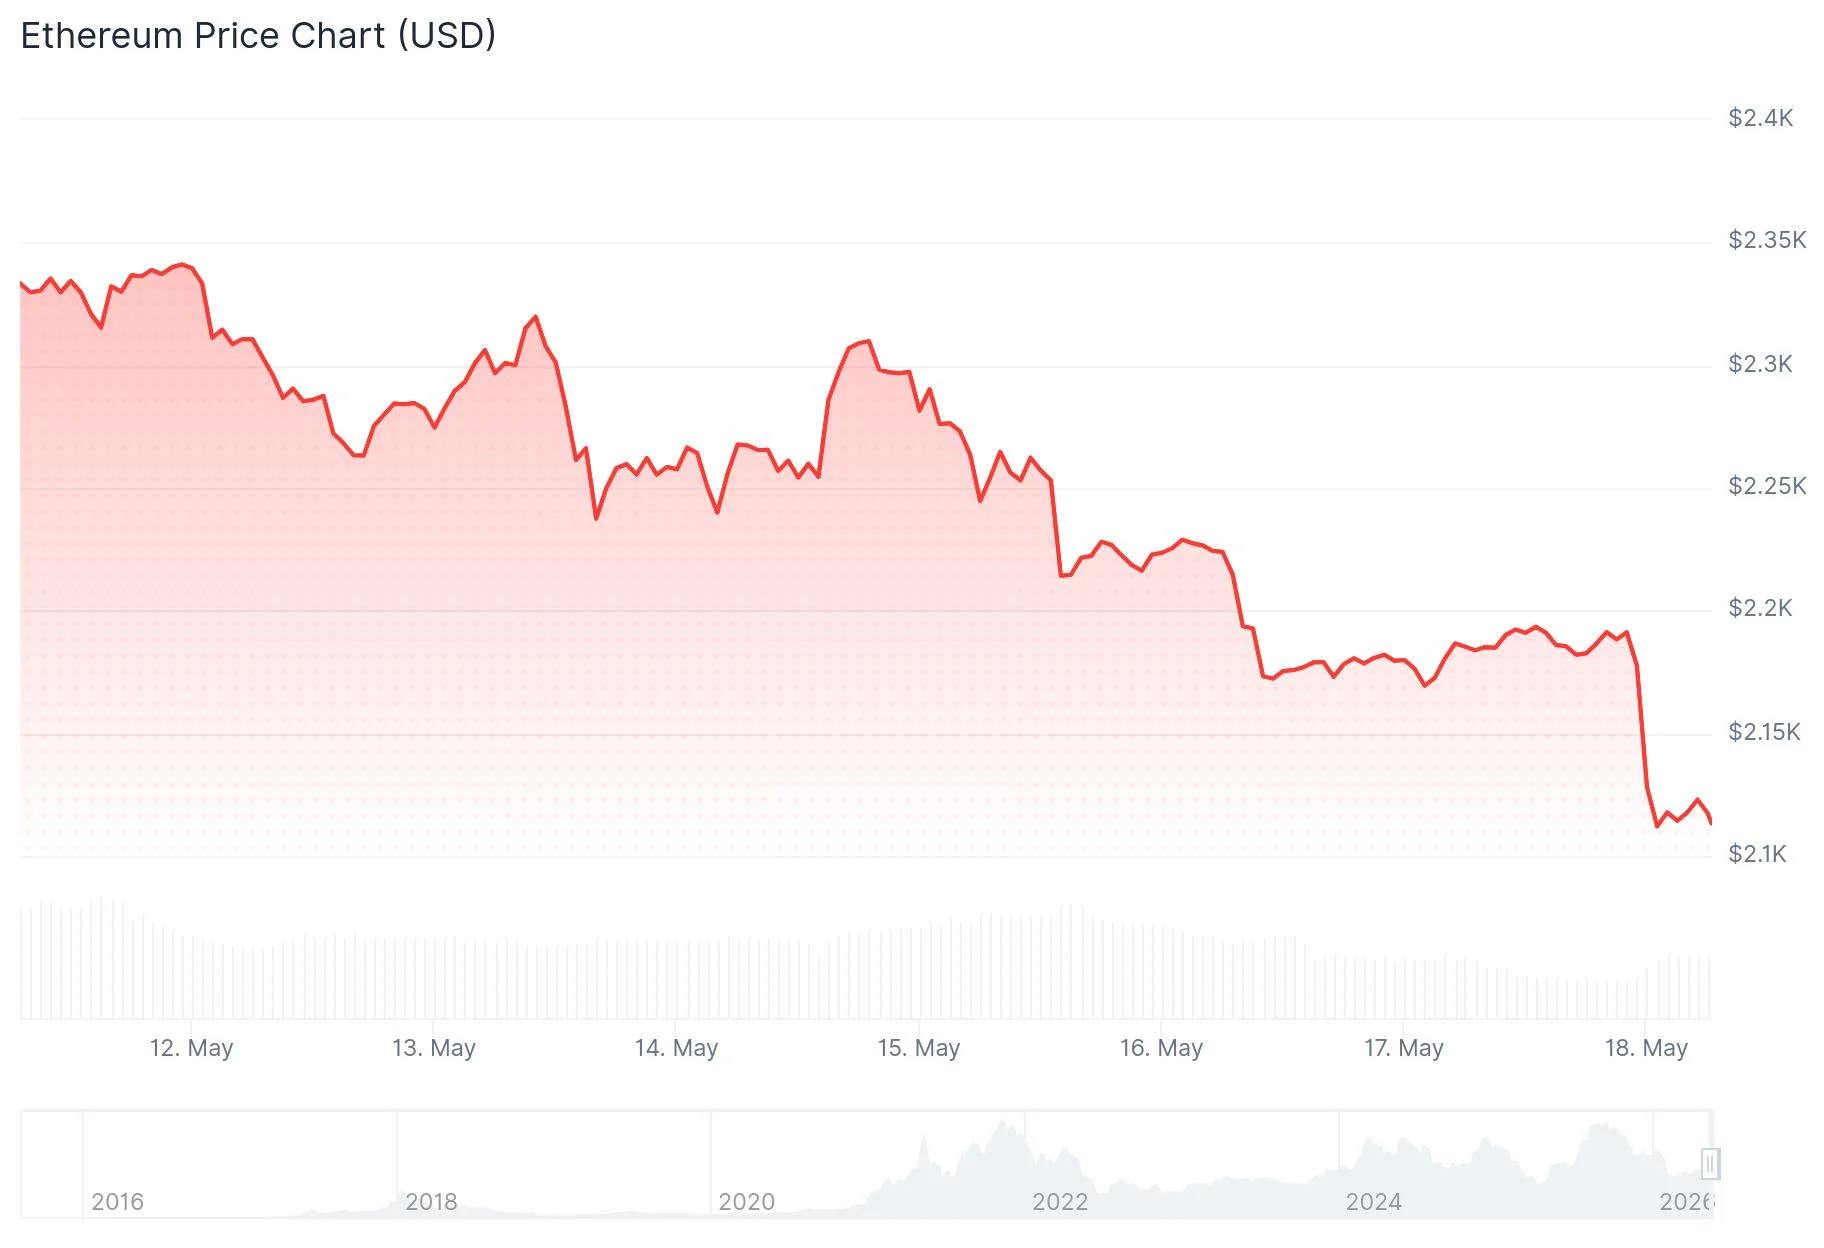
- ETH currently trades in the $2,184–$2,188 range, with critical support levels at $2,170 and $2,122
- Daily chart indicators show RSI at 39.57 and MACD in negative territory, indicating limited buying momentum
- An unfilled CME gap around $2,680 presents an upside opportunity; approximately $11B in short positions face liquidation risk at that level
- Companies now hold 7.33 million ETH in strategic reserves, valued at approximately $16 billion, representing about 6% of total circulation
- Price must successfully breach $2,300–$2,501 resistance before the $2,680 CME gap becomes a viable target
As of May 18, 2026, Ethereum finds itself trading around $2,185, positioned at a crucial juncture on its daily price chart. Market participants are attempting to defend the lower boundary of an established trading channel amid mounting technical pressure.
 Ethereum (ETH) Price
Technical momentum indicators reveal subdued buying activity. The Relative Strength Index currently registers 39.57, positioned beneath the neutral 50 threshold and signaling diminished bullish momentum. Meanwhile, the MACD configuration displays the main line at -20.2, the signal line at -15.8, and a negative histogram reading, collectively indicating that bearish forces remain dominant.
Market analyst More Crypto Online observed that the current price decline doesn’t exhibit characteristics of a complete distribution phase or definitive market peak. According to the analyst’s assessment, the retracement maintains a corrective structure provided ETH successfully maintains the lower channel support.
Analyst Cryptorphic provided additional perspective, noting that momentum deteriorated following a rejection from the upper resistance zone. The breach of local support demonstrated that bulls have temporarily lost short-term market control.
Critical Support and Resistance Thresholds
Immediate support exists at the $2,170 and $2,122 price levels. Should these zones fail to hold, attention would shift to $2,037 as the next significant support area.
Regarding upside potential, ETH must reclaim territory above $2,318 to establish a more constructive technical outlook. Beyond that threshold, $2,501 represents the primary Fibonacci resistance barrier, and a decisive break above this level would establish a pathway toward the $2,680 target.
Analyst Max Crypto highlighted that Ethereum maintains an unfilled CME futures gap positioned near $2,680. These gap formations frequently act as price magnets when market momentum shifts favorably. Max also emphasized that approximately $11 billion worth of short positions could face forced liquidation should ETH rally to that level, potentially accelerating upward price action.
Institutional ETH Holdings Reach $16 Billion Milestone
Analyst Crypto Patel referenced CoinGlass statistics revealing that corporations maintaining strategic Ethereum positions now collectively hold 7.33 million ETH, valued at approximately $16 billion. This accumulation represents roughly 6% of Ethereum’s entire supply currently residing on corporate treasuries.
Patel interpreted this data as evidence of expanding institutional adoption. When larger portions of ETH become locked in long-term corporate reserves, it effectively constrains the available floating supply in the market.
Analyst Ted Pillows observed that Ethereum reached the anticipated $2,150 support region, suggesting that a rebound from this zone could materialize if the level proves resilient.
A longer-timeframe chart analysis from analyst Sangita_Gems identified ETH trading within a falling wedge pattern that resembles a previous recovery sequence. This technical formation projects a potential advance toward $7,000 if ETH achieves a successful breakout and subsequent range retest.
Currently, ETH continues to trade within its established channel structure, with $2,100 marking the lower trendline support and $2,501 defining the upper resistance objective.
The post Ethereum (ETH) Price Approaches Critical Support Zone — Technical Analysis Shows What’s Next appeared first on Blockonomi.


You May Also Like

Robotics Automation Prototyping: Engineering Kinetic Agility into End-Effectors

Gold Price Falls to 1.5-Month Low as Iran War Drives Bond Yields Higher


