

Bitcoin vs. Gold: This Elliott Wave Chart Says the Real Move Hasn’t Started
The BTC/Gold ratio sits near 17 after a textbook ABC zigzag. Coins_Kid on X says the third wave up is just beginning. This is pure TA, not financial advice.
On the weekly BTC/Gold pair, currently trading near 17.02, a different picture has been forming quietly for the better part of two years. Most traders haven’t looked. The ones who have are watching one specific level very carefully right now.
The Setup Nobody Wants to Talk About
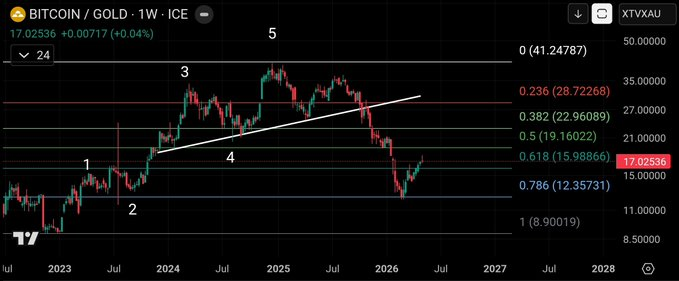
Crypto analyst Coins_Kid posted the BTC/Gold weekly chart to X, flagging what he described as a completed Elliott Wave structure. The reading starts back in late 2022. From that low, the ratio printed a clean five-wave advance stretching all the way into late 2024, with wave five tagging the chart’s peak near the 41-point area on the Fibonacci extension.
What followed was the pullback.
A standard ABC zigzag, per Coins_Kid’s count on X. The A leg dropped sharply. The B leg gave a modest recovery. Then the C wave came in hard, and that’s where the ratio sits now, pressing into the 0.618 Fibonacci retracement zone near 15.98. The chart shows the ratio at 17.02, bouncing off that zone.
The 0.786 retracement sits at 12.35. That level hasn’t been tested. Coins_Kid’s read doesn’t require it to be.
What the Fibonacci Levels Are Actually Saying
The retracement grid on the chart tells its own story. The 0.236 sits at 28.72. The 0.382 at 22.96. The ratio spent most of 2024 between those two zones, breaking down steadily as gold extended its own multi-year run in dollar terms.
A look at the BTC/Gold ratio’s prior extreme lows shows the current zone has historically aligned with multi-year accumulation bottoms. The pattern isn’t new. What’s new is how clean the wave structure looks.
The 2025 BTC/USD all-time high, per Coins_Kid’s framing, was a bulltrap. His words on X: “No one is looking at the truth of the market. Stop looking at BTC/USD. It made a bulltrap high in 2025.”
That’s a strong claim. The ratio chart is the argument behind it.
Third Wave Logic
In classical Elliott Wave theory, third waves are typically the longest and sharpest impulse moves. If waves one through two are complete on the BTC/Gold ratio, and the ABC corrective sequence has finished around current levels, then the next structural move is wave three up.
Coins_Kid put it plainly on X: “In theory the next wave up is a 3rd wave to all time highs as we begin to see that liquidity rotation kick in.”
Liquidity rotation is the mechanism. Gold has already run. Money looking for a higher-beta return has somewhere familiar to rotate into. The ratio bottoming near the 0.618 retracement would fit that thesis almost perfectly. Almost.
The word “theory” in that post is doing real work. Elliott counts can be invalidated. A break below 12.35, the 0.786 level, would put the bullish count under serious pressure.
What the Chart Doesn’t Show
Analysis on the BTC/Gold signal has been building across multiple frameworks over recent months. Correlation data, RSI readings on the weekly pair, on-chain accumulation. The Elliott count is one layer of a wider technical picture that keeps pointing at the same zone.
None of that guarantees anything. Wave four on this same chart ran sideways for roughly 18 months before the fifth wave broke higher.
The ratio is at 17.02. The next major resistance on a recovery move would be around 19.16, the 0.5 retracement level, before the 22.96 area comes into view. A long way from the old highs near 41.
Disclaimer: This article is based solely on technical analysis from the cited source. It is not financial or investment advice.
The post Bitcoin vs. Gold: This Elliott Wave Chart Says the Real Move Hasn’t Started appeared first on Live Bitcoin News.


You May Also Like

Santiment Flags Risk as Bullish Talk Rises While BTC Holds $80k

Crypto Institutional Adoption Is Rewriting the Rules of the Global Financial Market


