Amgen’s operating margin recovered to 34% in Q1 2026 as SG&A discipline offset a 16% surge in R&D spending.Amgen’s operating margin recovered to 34% in Q1 2026 as SG&A discipline offset a 16% surge in R&D spending.

Amgen Stock’s Gross Margin Story in Q1 2026: What the Numbers Say About a $468 Target

2026/06/16 16:05
6 min read
For feedback or concerns regarding this content, please contact us at crypto.news@mexc.com

Key Takeaways for Amgen Stock

  • Amgen’s six key growth drivers generated $5.6 billion in Q1 2026 sales, growing 24% year-over-year to represent nearly 70% of total product sales.
  • Operating income reached $2.91 billion in Q1 2026, up 24% year-over-year, as operating margin recovered to 34% from 29% a year prior while R&D spending grew 16% year-over-year in Q1 2026, with the increase directed at late-stage MariTide, IMDELLTRA, and Olpasiran programs.
  • TIKR’s model values Amgen at approximately $468 by December 2030, implying around 33% total return from the current price.

The income statement shows operating margin recovering toward 34% even as Amgen accelerates pipeline investment. See the full financial picture on TIKR and explore whether AMGN stock is priced for what comes next→

Amgen Stock’s Growth Drivers Delivered 24% Sales Growth Even as Prolia Erodes

amgen stock q1 2026 earnings in USDAMGN Stock Q1 2026 Earnings in USD (TIKR)

Amgen (AMGN) reported Q1 2026 total revenues of $8.62 billion, up 6% year-over-year, as a diversified growth portfolio absorbed accelerating losses from its denosumab franchise.

Amgen is one of the world’s largest biopharmaceutical companies, developing medicines for cancer, cardiovascular disease, rare conditions, and obesity.

The headline number understates the internal momentum: six designated growth drivers (Repatha, EVENITY, TEZSPIRE, innovative oncology, rare disease, and biosimilars) collectively grew 24% year-over-year.

Repatha, Amgen’s PCSK9 inhibitor for cardiovascular risk reduction, led the group with $876 million in quarterly sales, up 34% year-over-year, driven by new prescribing data from the VESALIUS-CV trial published in JAMA.

Prolia and XGEVA combined fell 32% year-over-year to $1.1 billion as biosimilar competition accelerated following loss of exclusivity.

CFO Peter Griffith described this dynamic as exactly what management had modeled: “Our strong first quarter performance reinforces that outlook,” referring to the company’s stated goal of growing through patent expirations via newer assets.

UPLIZNA, Amgen’s antibody therapy for rare autoimmune conditions, delivered $262 million in quarterly sales, up 188% year-over-year, reflecting new indications in generalized myasthenia gravis and IgG4-related disease approved in late 2025.

MariTide, Amgen’s obesity antibody-peptide conjugate designed for monthly or less frequent dosing, remains in Phase III development with multiple ongoing studies, including a newly announced SWITCH trial evaluating patients transitioning from weekly GLP-1 therapies.

Amgen raised full-year 2026 revenue guidance to a range of $37.1 billion to $38.5 billion and non-GAAP EPS guidance to a range of $21.70 to $23.10.

The transcript tells a story of operating leverage building underneath LOE headwinds. The income statement shows whether that leverage is showing up yet→

Operating Leverage Building as R&D Investment Climbs and Gross Margin Stabilizes

amgen stock quarterly financialsAMGN Stock Quarterly Financials (TIKR)

Amgen’s gross margin came in at 71% in Q1 2026, holding within the range established over the prior four quarters despite mix pressure from higher profit-share and royalty expenses flagged by management.

Total revenues grew 6% year-over-year to $8.62 billion, while total operating expenses contracted to $3.21 billion from $3.20 billion in the year-ago quarter.

That near-flat opex against a revenue increase drove operating income to $2.91 billion, a 24% year-over-year increase.

Operating margin recovered to 34% in Q1 2026, up from 29% in Q1 2025, reversing the compression that had weighed on the income statement through 2024.

R&D spending rose to $1.72 billion in the quarter, up 16% year-over-year, as Amgen accelerated investment behind MariTide’s Phase III program and late-stage assets including Olpasiran and IMDELLTRA.

The tension in the income statement is clear: gross margin has stabilized while R&D is expanding, meaning operating margin gains are being funded by SG&A discipline rather than gross profit expansion.

SG&A declined to $1.60 billion in Q1 2026, the lowest quarterly figure in the eight-quarter window, creating the cost room that allowed R&D to expand without compressing operating income.

The question the income statement poses is whether Amgen can sustain this balance as LOE headwinds accelerate through the remainder of 2026 and MariTide manufacturing investment intensifies.

Gilead Leads Amgen and AbbVie on Operating Margins, But AMGN’s Q1 Recovery Narrows the Gap

amgen stock operating margins vs peersAMGN Stock Operating Margins vs GILD Stock and ABBV Stock (TIKR)

Gilead Sciences (GILD) posted a 39% operating margin in Q1 2026, holding its structural lead over both Amgen and AbbVie across every quarter in the trailing eight-quarter window.

Amgen’s operating margin recovered to 34% in Q1 2026, up from 29% in the year-ago quarter, closing roughly half the gap it had opened against Gilead through the 2024 trough.

Meanwhile, AbbVie’s (ABBV) operating margin came in at 32% in Q1 2026, its lowest reading in the eight-quarter window, as post-Humira reinvestment costs continued to weigh on the income statement.

The spread between Gilead at 39% and Amgen at 34% in the most recent quarter is narrower than at any point since mid-2024, when Amgen’s margin trough of 29% left it 9 points behind Gilead.

Amgen’s recovery is the most directionally significant in the peer group: its operating margin has expanded 5 points year-over-year while AbbVie’s has compressed 2 points over the same period.

TIKR’s $468 Target on Amgen Stock Requires the Margin Recovery to Hold Through the Pipeline Build

TIKR’s model values Amgen at approximately $468 by December 2030, implying around 33% total return from the current price of $351, or roughly 7% per year.

amgen stock valuation model results
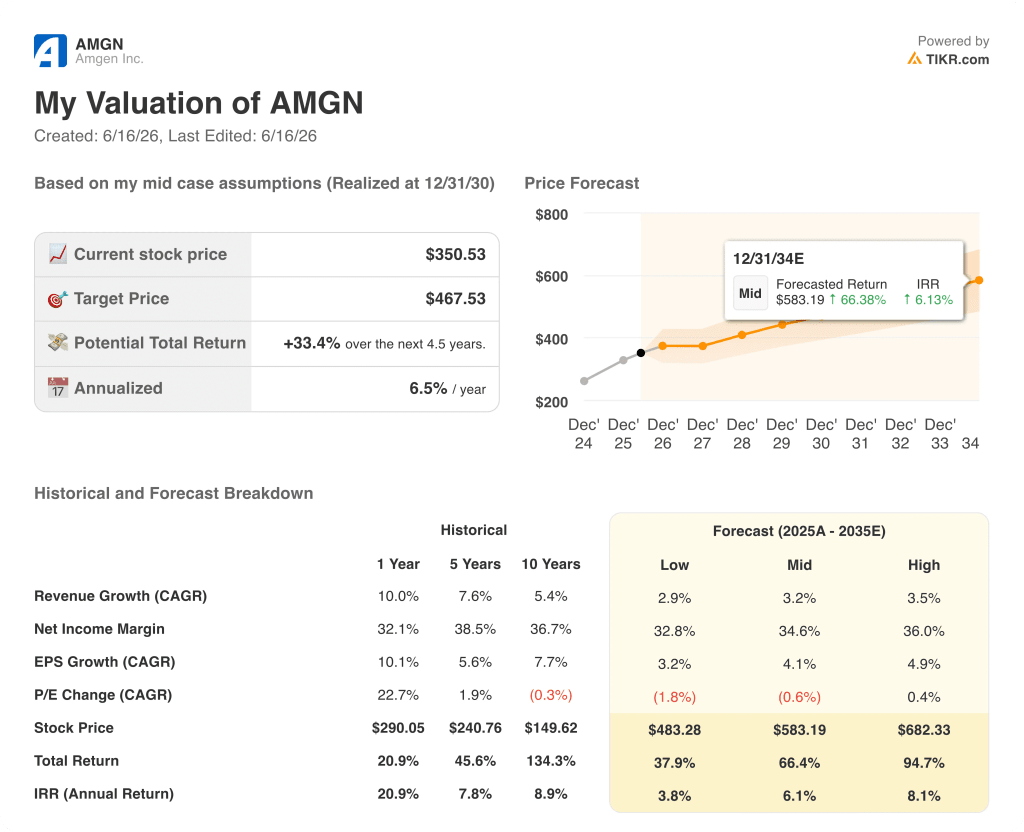
AMGN Stock Valuation Model Results (TIKR)

The income statement case for that target rests on the operating leverage pattern already visible in Q1 2026: SG&A holding flat or declining as revenue scales, creating margin room to absorb the R&D step-up without degrading operating income.

If Amgen’s growth drivers sustain their 24% collective growth rate while opex discipline holds, the operating margin trajectory already underway supports the model’s assumptions before any MariTide contribution.

The TIKR model quantifies what has to hold in Amgen’s income statement for the target to be reachable. Explore TIKR’s full valuation model for AMGN stock for free →

Should You Invest in Amgen Inc.?

The only way to really know is to look at the numbers yourself. TIKR gives you free access to the same institutional-quality financial data that professional analysts use to answer exactly that question.

Pull up Amgen Inc. stock and you’ll see years of historical financials, what Wall Street analysts expect for revenue and earnings in the quarters ahead, how valuation multiples have moved over time, and whether price targets are trending up or down.

You can build a free watchlist to track Amgen Inc. alongside every other stock on your radar. No credit card required. Just the data you need to decide for yourself.

Access Professional Tools to Analyze AMGN stock on TIKR for Free →

What did Amgen say about MariTide at the Q1 2026 earnings call?

Amgen announced new Phase III extension studies evaluating less frequent MariTide dosing for maintenance and a new SWITCH trial for patients transitioning from weekly GLP-1 therapies, with potential dosing as infrequent as 4 to 6 injections per year.

Market Opportunity
DAR Open Network Logo
DAR Open Network Price(D)
$0.0035
$0.0035$0.0035
-2.93%
USD
DAR Open Network (D) Live Price Chart
Disclaimer: The articles reposted on this site are sourced from public platforms and are provided for informational purposes only. They do not necessarily reflect the views of MEXC. All rights remain with the original authors. If you believe any content infringes on third-party rights, please contact crypto.news@mexc.com for removal. MEXC makes no guarantees regarding the accuracy, completeness, or timeliness of the content and is not responsible for any actions taken based on the information provided. The content does not constitute financial, legal, or other professional advice, nor should it be considered a recommendation or endorsement by MEXC.

You May Also Like

Ethereum koers toont zeldzaam dubbel koopsignaal en richt zich op $4.550

Ethereum koers toont zeldzaam dubbel koopsignaal en richt zich op $4.550

Connect met Like-minded Crypto Enthusiasts! Connect op Discord! Check onze Discord   Ethereum laat op de uurgrafiek twee opeenvolgende TD Sequential koopsignalen zien. Deze indicator meet uitputting in een trend en geeft vaak een signaal dat de verkoopdruk kan afnemen. Dit dubbele signaal verschijnt rond het niveau van $4.516, waar de ETH prijs kortstondig steun vindt. Dit type formatie komt zelden voor en wordt daarom extra nauwlettend gevolgd. Wat gaat de Ethereum koers hiermee doen? Ethereum koers test steun rond $4.516 De scherpe daling van de Ethereum koers vanaf de prijszone rond $4.800 bracht de ETH prijs in korte tijd naar ongeveer $4.516. Op dit niveau trad duidelijke koopactiviteit op, waardoor de neerwaartse beweging tijdelijk werd gestopt. Het dubbele signaal dat door de TD Sequential indicator is gegenereerd, viel precies samen met dit prijspunt. De TD Sequential is opgebouwd uit negen candles die een trend meetellen. Wanneer de negende candle verschijnt, kan dit duiden op een trendomslag. In dit geval verschenen zelfs twee signalen kort na elkaar, wat aangeeft dat de verkoopdruk mogelijk uitgeput is. Het feit dat dit gebeurde in een zone waar ETH kopers actief bleven, maakt het patroon extra opvallend. TD Sequential just flashed two buy signals for Ethereum $ETH! pic.twitter.com/JPO8EhiEPi — Ali (@ali_charts) September 16, 2025 Welke crypto nu kopen?Lees onze uitgebreide gids en leer welke crypto nu kopen verstandig kan zijn! Welke crypto nu kopen? Fed-voorzitter Jerome Powell heeft aangekondigd dat de rentes binnenkort zomaar eens omlaag zouden kunnen gaan, en tegelijkertijd blijft BlackRock volop crypto kopen, en dus lijkt de markt klaar om te gaan stijgen. Eén vraag komt telkens terug: welke crypto moet je nu kopen? In dit artikel bespreken we de munten die… Continue reading Ethereum koers toont zeldzaam dubbel koopsignaal en richt zich op $4.550 document.addEventListener('DOMContentLoaded', function() { var screenWidth = window.innerWidth; var excerpts = document.querySelectorAll('.lees-ook-description'); excerpts.forEach(function(description) { var excerpt = description.getAttribute('data-description'); var wordLimit = screenWidth wordLimit) { var trimmedDescription = excerpt.split(' ').slice(0, wordLimit).join(' ') + '...'; description.textContent = trimmedDescription; } }); }); Technische indicatoren schetsen herstelkans voor ETH Naast de dubbele koopsignalen verstrekken ook andere indicatoren belangrijke aanwijzingen. Tijdens de daling van de ETH koers waren grote rode candles zichtbaar, maar na de test van $4.516 stabiliseerde de Ethereum koers. Dit wijst op een mogelijke verschuiving in het evenwicht tussen de bears en bulls. Als deze opwaartse beweging doorzet, liggen de eerste weerstanden rond $4.550. Daarboven wacht een sterkere zone rond $4.650. Deze niveaus zijn in eerdere Ethereum sessies al meerdere keren getest. Een doorbraak zou ruimte openen richting de all-time high van ETH rond $4.953. Wanneer de prijs toch opnieuw onder $4.516 zakt, liggen er zones rond $4.500 en $4.450 waar grotere kooporders worden verwacht. Deze niveaus kunnen als een vangnet fungeren, mocht de druk opnieuw toenemen. Marktdynamiek bevestigt technische indicatoren De huidige situatie volgt op een bredere correctie in de cryptomarkt. Verschillende vooraanstaande crypto tokens zagen scherpe koersdalingen, waarna traders op zoek gingen naar signalen voor een mogelijke ommekeer. Dat juist Ethereum nu een dubbel TD Sequential signaal toont, versterkt de interesse in dit scenario. Fundamenteel blijft Ethereum sterk. Het aantal ETH tokens dat via staking is vastgezet, blijft groeien. Dat verkleint de vrije circulatie en vermindert verkoopdruk. Tegelijk blijft het netwerk intensief gebruikt voor DeFi, NFT’s en stablecoins. Deze activiteiten zorgen voor een stabiele vraag naar ETH, ook wanneer de prijs tijdelijk onder druk staat. Fundamentele drijfveren achter de Ethereum koers De Ethereum koers wordt echter niet alleen bepaald door candles en patronen, maar ook door bredere factoren. Een stijgend percentage van de totale ETH supply staat vast in staking contracten. Hierdoor neemt de liquiditeit op exchanges af. Dit kan prijsschommelingen versterken wanneer er plotseling meer koopdruk ontstaat. Daarnaast is Ethereum nog steeds het grootste smart contract platform. Nieuwe standaarden zoals ERC-8004 en ontwikkelingen rond layer-2 oplossingen houden de activiteit hoog. Deze technologische vooruitgang kan de waardepropositie ondersteunen en zo indirect bijdragen aan een ETH prijsherstel. Het belang van de korte termijn dynamiek De komende handelsdagen zullen duidelijk maken of de bulls genoeg kracht hebben om door de weerstandszone rond $4.550 te breken. Voor de bears ligt de focus juist op het verdedigen van de prijsregio rond $4.516. De whales, die met grote handelsorders opereren, kunnen hierin een beslissende rol spelen. Het dubbele TD Sequential signaal blijft hoe dan ook een zeldzame gebeurtenis. Voor cryptoanalisten vormt het een objectief aanknopingspunt om de kracht van de huidige Ethereum trend te toetsen. Vooruitblik op de ETH koers Ethereum liet twee opeenvolgende TD Sequential signalen zien op de uurgrafiek, iets wat zelden voorkomt. Deze formatie viel samen met steun rond $4.516, waar de bulls actief werden. Als de Ethereum koers boven dit niveau blijft, kan er ruimte ontstaan richting $4.550 en mogelijk $4.650. Zakt de prijs toch opnieuw onder $4.516, dan komen $4.500 en $4.450 in beeld als nieuwe steunzones. De combinatie van zeldzame indicatoren en een sterke fundamentele basis maakt Ethereum interessant voor zowel technische als fundamentele analyses. Of de bulls het momentum echt kunnen overnemen, zal blijken zodra de Ethereum koers de eerstvolgende weerstanden opnieuw test. Koop je crypto via Best Wallet Best wallet is een topklasse crypto wallet waarmee je anoniem crypto kan kopen. Met meer dan 60 chains gesupport kan je al je main crypto coins aanschaffen via Best Wallet. Best wallet - betrouwbare en anonieme wallet Best wallet - betrouwbare en anonieme wallet Meer dan 60 chains beschikbaar voor alle crypto Vroege toegang tot nieuwe projecten Hoge staking belongingen Lage transactiekosten Best wallet review Koop nu via Best Wallet Let op: cryptocurrency is een zeer volatiele en ongereguleerde investering. Doe je eigen onderzoek. Het bericht Ethereum koers toont zeldzaam dubbel koopsignaal en richt zich op $4.550 is geschreven door Dirk van Haaster en verscheen als eerst op Bitcoinmagazine.nl.
Share
Coinstats2025/09/17 23:31
Fed Day Dry Powder: Cryptoquant Analyst Tracks $7.6B Stablecoin Pile on Exchanges

Fed Day Dry Powder: Cryptoquant Analyst Tracks $7.6B Stablecoin Pile on Exchanges

The post Fed Day Dry Powder: Cryptoquant Analyst Tracks $7.6B Stablecoin Pile on Exchanges appeared on BitcoinEthereumNews.com. With the Federal Reserve meeting today, onchain flows are telegraphing that crypto traders are topping off exchanges and leaning long ahead of a widely expected 25-basis-point cut. Pre-Fed Positioning Stablecoins are doing the heavy lifting. Cryptoquant data shows $7.6 billion in fresh USDT and USDC (ERC-20) deposits heading to trading venues ahead of the decision. […] Source: https://news.bitcoin.com/fed-day-dry-powder-cryptoquant-analyst-tracks-7-6b-stablecoin-pile-on-exchanges/
Share
BitcoinEthereumNews2025/09/18 01:36
Michael Saylor’s Bitcoin Treasury Strategy Has Finally Hit Its Breaking Point

Michael Saylor’s Bitcoin Treasury Strategy Has Finally Hit Its Breaking Point

Bitcoin (CRYPTO:BTC) transformed from a niche digital asset into a mainstream investment over the past decade, and few people did more to accelerate that shift
Share
247 Wall St.2026/06/28 20:17

Newbies:Deposit $100, Get $1,000

Newbies:Deposit $100, Get $1,000Newbies:Deposit $100, Get $1,000

Plus Up to a $50 Referral Bonus