

Bitcoin price today at $60K: Fear Index hits 13 as $10B expiry looms

As of June 26, 2026, Bitcoin price today hovers near $60,136 — a level shaped by distribution pressure and a market that has lost its structural bid. BTC dominance above 55% confirms the weakness originates from the top. The daily chart makes the precariousness unmistakably clear.
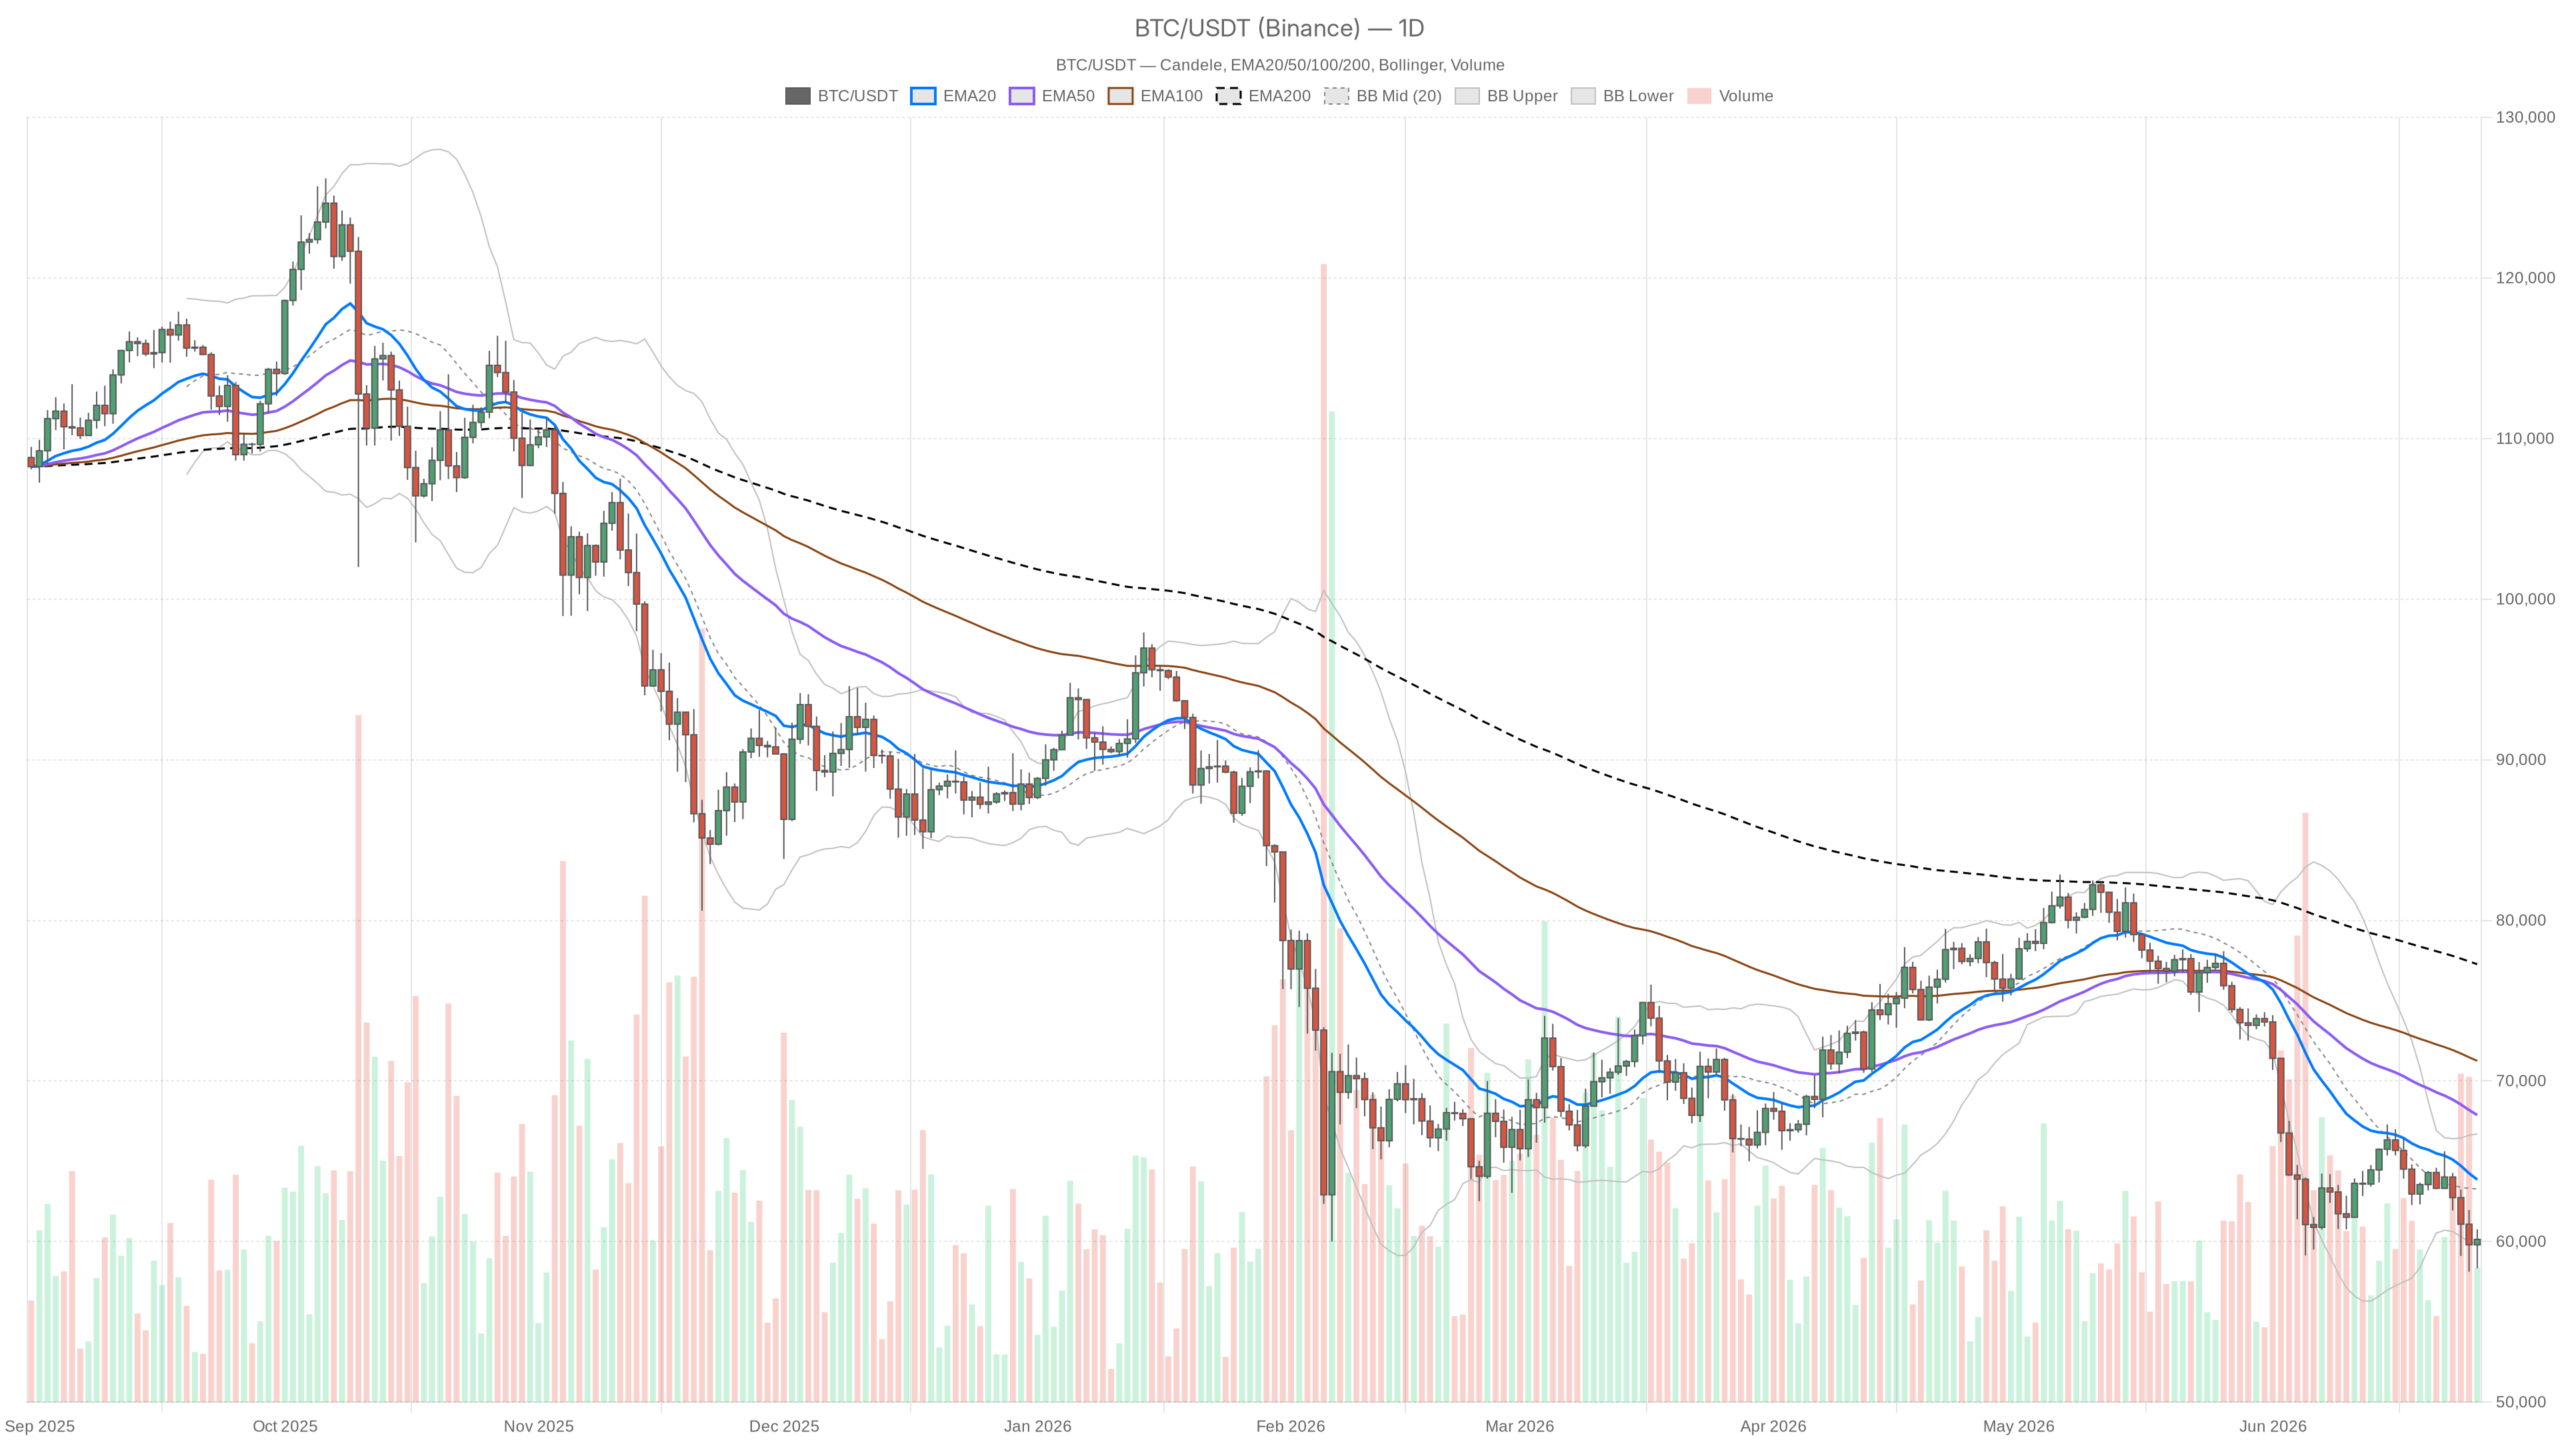 BTC/USDT — daily chart with candlesticks, EMA20/EMA50 and volume.
Key takeaways
- Bitcoin sits at $60,136 with price below all major daily moving averages, confirming a bearish regime.
- Daily RSI at 32.16 signals deep stress without capitulation, while the Fear & Greed Index at 13 reflects Extreme Fear.
- Critical levels to watch: $61,152 resistance and $58,729 support on daily pivot points.
- A $10 billion options expiry flagged by Bloomberg adds near-term mechanical risk that could amplify any directional move.
- Daily ATR of $2,216 means sharp intraday swings of several percent remain entirely within normal range.
The macro backdrop offers little relief. Bloomberg reports fresh scrutiny of Strategy’s leveraged Bitcoin financing model, championed by Michael Saylor, which has historically driven institutional BTC accumulation. Moreover, CNBC’s headline — “Bitcoin is having a tough year. Traders are betting it’s going to get worse” — reflects genuine positioning rather than contrarian noise. A $10 billion options expiry adds near-term mechanical risk capable of amplifying moves in either direction. This is not a market hunting for reasons to buy. It is a market seeking confirmation that selling was the right call.
The daily chart confirms an unambiguous bearish regime
The daily chart leaves no room for ambiguity: the regime is bearish and the structure fully justifies that classification. Price at $60,136 sits below every meaningful moving average — the 20 EMA at $63,856, the 50 EMA at $67,873, and the 200 EMA at $77,268. That stacking — price under the 20, which is under the 50, which is under the 200 — represents textbook trend deterioration. Each of those levels now functions as a ceiling, not a floor. The 200 EMA resting nearly $17,000 above current price reveals just how far this market has travelled from its healthiest structural state.
The daily RSI at 32.16 hovers just above the oversold threshold without crossing it. That is a nuanced signal: the market is deeply stressed, yet it has not capitulated into a level that typically triggers aggressive dip-buying. Historically, RSI readings in the low 30s on the daily can persist for weeks in a genuine downtrend before finding a durable floor. Do not mistake proximity to oversold as proximity to a bottom. In bear markets, oversold conditions tend to resolve sideways or lower rather than with V-shaped recoveries.
Meanwhile, the daily MACD sits negative at -2,282 with the signal line at -2,288. The histogram has ticked to a marginally positive +5.46, which is the first whisper of momentum deceleration in the bearish trend. However, it is not a reversal signal — it is barely a flicker. What it does suggest is that the rate of selling is easing slightly. Momentum is losing velocity without changing direction. That is a prerequisite for a base, not confirmation of one.
Bollinger Bands frame the picture clearly: the midline sits at $63,272 and price presses against the lower band at $59,845. When price hugs the lower band with RSI in the low 30s and MACD still deeply negative, you are watching a sustained downtrend in motion. The upper band at $66,700 is so far removed it is essentially irrelevant to near-term trading. Furthermore, the daily ATR of $2,216 confirms that meaningful moves — several percent intraday — are entirely within normal range. Volatility is real and the risk of sharp swings cannot be dismissed.
Daily pivot analysis places the pivot point at $59,744, with R1 resistance at $61,152 and S1 support at $58,729. Price currently sits between the PP and R1, a tentative position at best. Breaking $61,152 with conviction would be the first structural step toward healing the short-term picture. Conversely, losing $58,729 opens space toward the $57,000–$58,000 range with limited technical support in between.
Intraday structure offers a short-term flicker of life
The hourly chart provides a mildly constructive signal within the broader downtrend, though it stops well short of confirming any reversal. The regime is classified as neutral, and the MACD histogram on the 1H has surged to +145.8, with the MACD line crossing above the signal line. That is the kind of momentum shift short-term traders actually care about. Price at $60,142 sits just above the 1H 20 EMA at $60,053, having reclaimed it from below — a short-term positive. The 1H RSI at 49.75 is essentially neutral, with no overbought pressure and no panic selling.
That said, the 1H 200 EMA at $62,550 aligns roughly with the zone where most intraday rallies have been fading. The 1H Bollinger midline at $59,748 has already been reclaimed by price, which adds a small tick to the constructive column. However, a bounce on the 1H within a daily downtrend is a tactical opportunity at best, not a strategic shift. The hourly picture says “relief rally possible,” not “trend reversal confirmed.”
The 15-minute frame is already losing steam
The very near-term momentum on the 15-minute chart is already fading. Price sits almost exactly at its 20 EMA at $60,141, with RSI at 52 — acceptable, but the MACD histogram has just flipped negative at -35.77 after the line failed to hold above signal. This is the first indication that micro-momentum is deteriorating. Execution-wise, this is not the moment for aggressive entries in either direction. The 15-minute frame suggests a micro-consolidation or minor pullback is more likely than an immediate continuation of the hourly bounce.
Market sentiment sits deep in Extreme Fear
The Fear & Greed Index at 13 reflects Extreme Fear, and history offers a split verdict on what that means. Contrarians will correctly point to this as a potential sentiment floor. However, the critical distinction is whether Extreme Fear occurs after a sharp flush — which can mark bottoms — or during a grinding, structural downtrend, which can persist far longer than anyone expects. Given the daily chart’s configuration, Bitcoin price today resembles the latter scenario far more than the former.
Capitulation has not yet materialised in price terms. The market has been bleeding slowly rather than crashing violently. Extreme Fear in a slow bleed carries different implications than Extreme Fear after a violent drop. The former tends to drag on; the latter can reverse sharply. Traders banking on a sentiment-driven rebound should weigh that distinction carefully before committing capital.
Two scenarios worth watching closely
The bullish case demands a daily close above $61,152 — R1 on the pivot — ideally accompanied by a recovery in hourly volume and a daily MACD histogram that keeps expanding toward zero. If that materialises, $63,272, the daily Bollinger midline, becomes the next test. Reclaiming that level would begin putting the 20 EMA back in play. However, this scenario gets invalidated immediately if price rolls back below the daily pivot at $59,744. That would confirm the bounce was nothing more than a technical reflex inside a continuing downtrend.
The bearish continuation scenario — which the daily structure currently favours — sees $58,729 give way on the next leg down, potentially accelerating toward $57,000–$57,500 where the next cluster of historical support sits. The large options expiry creates a mechanical risk that could force that kind of move regardless of organic buying or selling pressure. This scenario only gets seriously challenged if price decisively closes above $63,856 on strong volume, something that has not happened in weeks based on the current EMA configuration.
What this means for positioning right now
The honest assessment is straightforward: the daily trend is bearish, sentiment is in the gutter, and the intraday bounce lacks the structural weight to reverse the macro picture. The Fear & Greed Index at 13 means the majority of market participants are scared, but scared markets can stay scared for extended periods. Anyone operating in this environment must respect the daily ATR of over $2,200. That is not noise — it is the actual range of risk per candle.
The setup that matters most over the next 48 to 72 hours is how Bitcoin handles the $58,700–$60,200 range. A clean hold and expansion higher would change the short-term tone. A breakdown through $58,700 would change something more fundamental. Volatility is elevated, the options market remains a live wildcard, and the news cycle is not constructive. That combination demands position sizing that reflects uncertainty rather than conviction, regardless of which direction you are leaning.
FAQ
Why is Bitcoin under so much selling pressure right now?
Distribution pressure is meeting a market that has lost its structural bid, with price sitting below all major daily moving averages. The macro backdrop adds further weight: scrutiny of Strategy’s leveraged Bitcoin model, bearish positioning reflected in options markets, and a $10 billion expiry creating mechanical risk. Together, these factors have stripped the market of the dip-buying appetite seen in previous cycles.
What are the most important support and resistance levels to watch?
The critical levels are $61,152 on the upside (daily R1 pivot) and $58,729 on the downside (daily S1 support). Above that, $63,272 — the daily Bollinger Band midline — marks the next resistance zone. Below S1, the $57,000–$57,500 range represents the next cluster of historical support. A daily close above $63,856 would be needed to begin challenging the bearish structure.
Is Extreme Fear on the Fear & Greed Index a reliable buy signal?
Not automatically. Extreme Fear after a sharp, violent flush has historically marked bottoms, but Extreme Fear during a slow, grinding downtrend can persist for weeks. The current reading of 13 reflects a market bleeding slowly rather than capitulating, which reduces the reliability of a contrarian buy signal. The daily chart’s bearish configuration further supports caution over aggressive dip-buying.
The daily structure remains firmly bearish, and nothing on the intraday charts contradicts that broader reality. Until Bitcoin reclaims key levels with conviction — starting with $61,152 — the path of least resistance points lower. Volatility is elevated, sentiment is fragile, and the options market adds a layer of mechanical uncertainty. In this environment, respecting risk matters more than chasing direction.
Disclaimer: This article is for informational purposes only and does not constitute financial advice, an investment recommendation, or a solicitation to buy or sell any financial instrument or cryptocurrency. The analysis provided is not indicative of future results. Investing in crypto assets and financial markets carries a high risk of capital loss. Always do your own research (DYOR) and consult a qualified financial advisor before making any decision.
Article produced with the assistance of artificial intelligence and reviewed by the editorial team.


You May Also Like

Neymar Net Worth 2026: Salary, Endorsements, Santos Contract, Career Earnings and World Cup Impact

AAVE Price Jumps Over 10% as Aave V4 Deposits Boost Bullish Sentiment

Globalstar (GSAT) Stock Surges 15% on Amazon Acquisition Report


