

Alphabet Fell 5% in a Single Day as AI Stars Defected. Is the Selloff Overdone?
Key Stats for Alphabet Stock
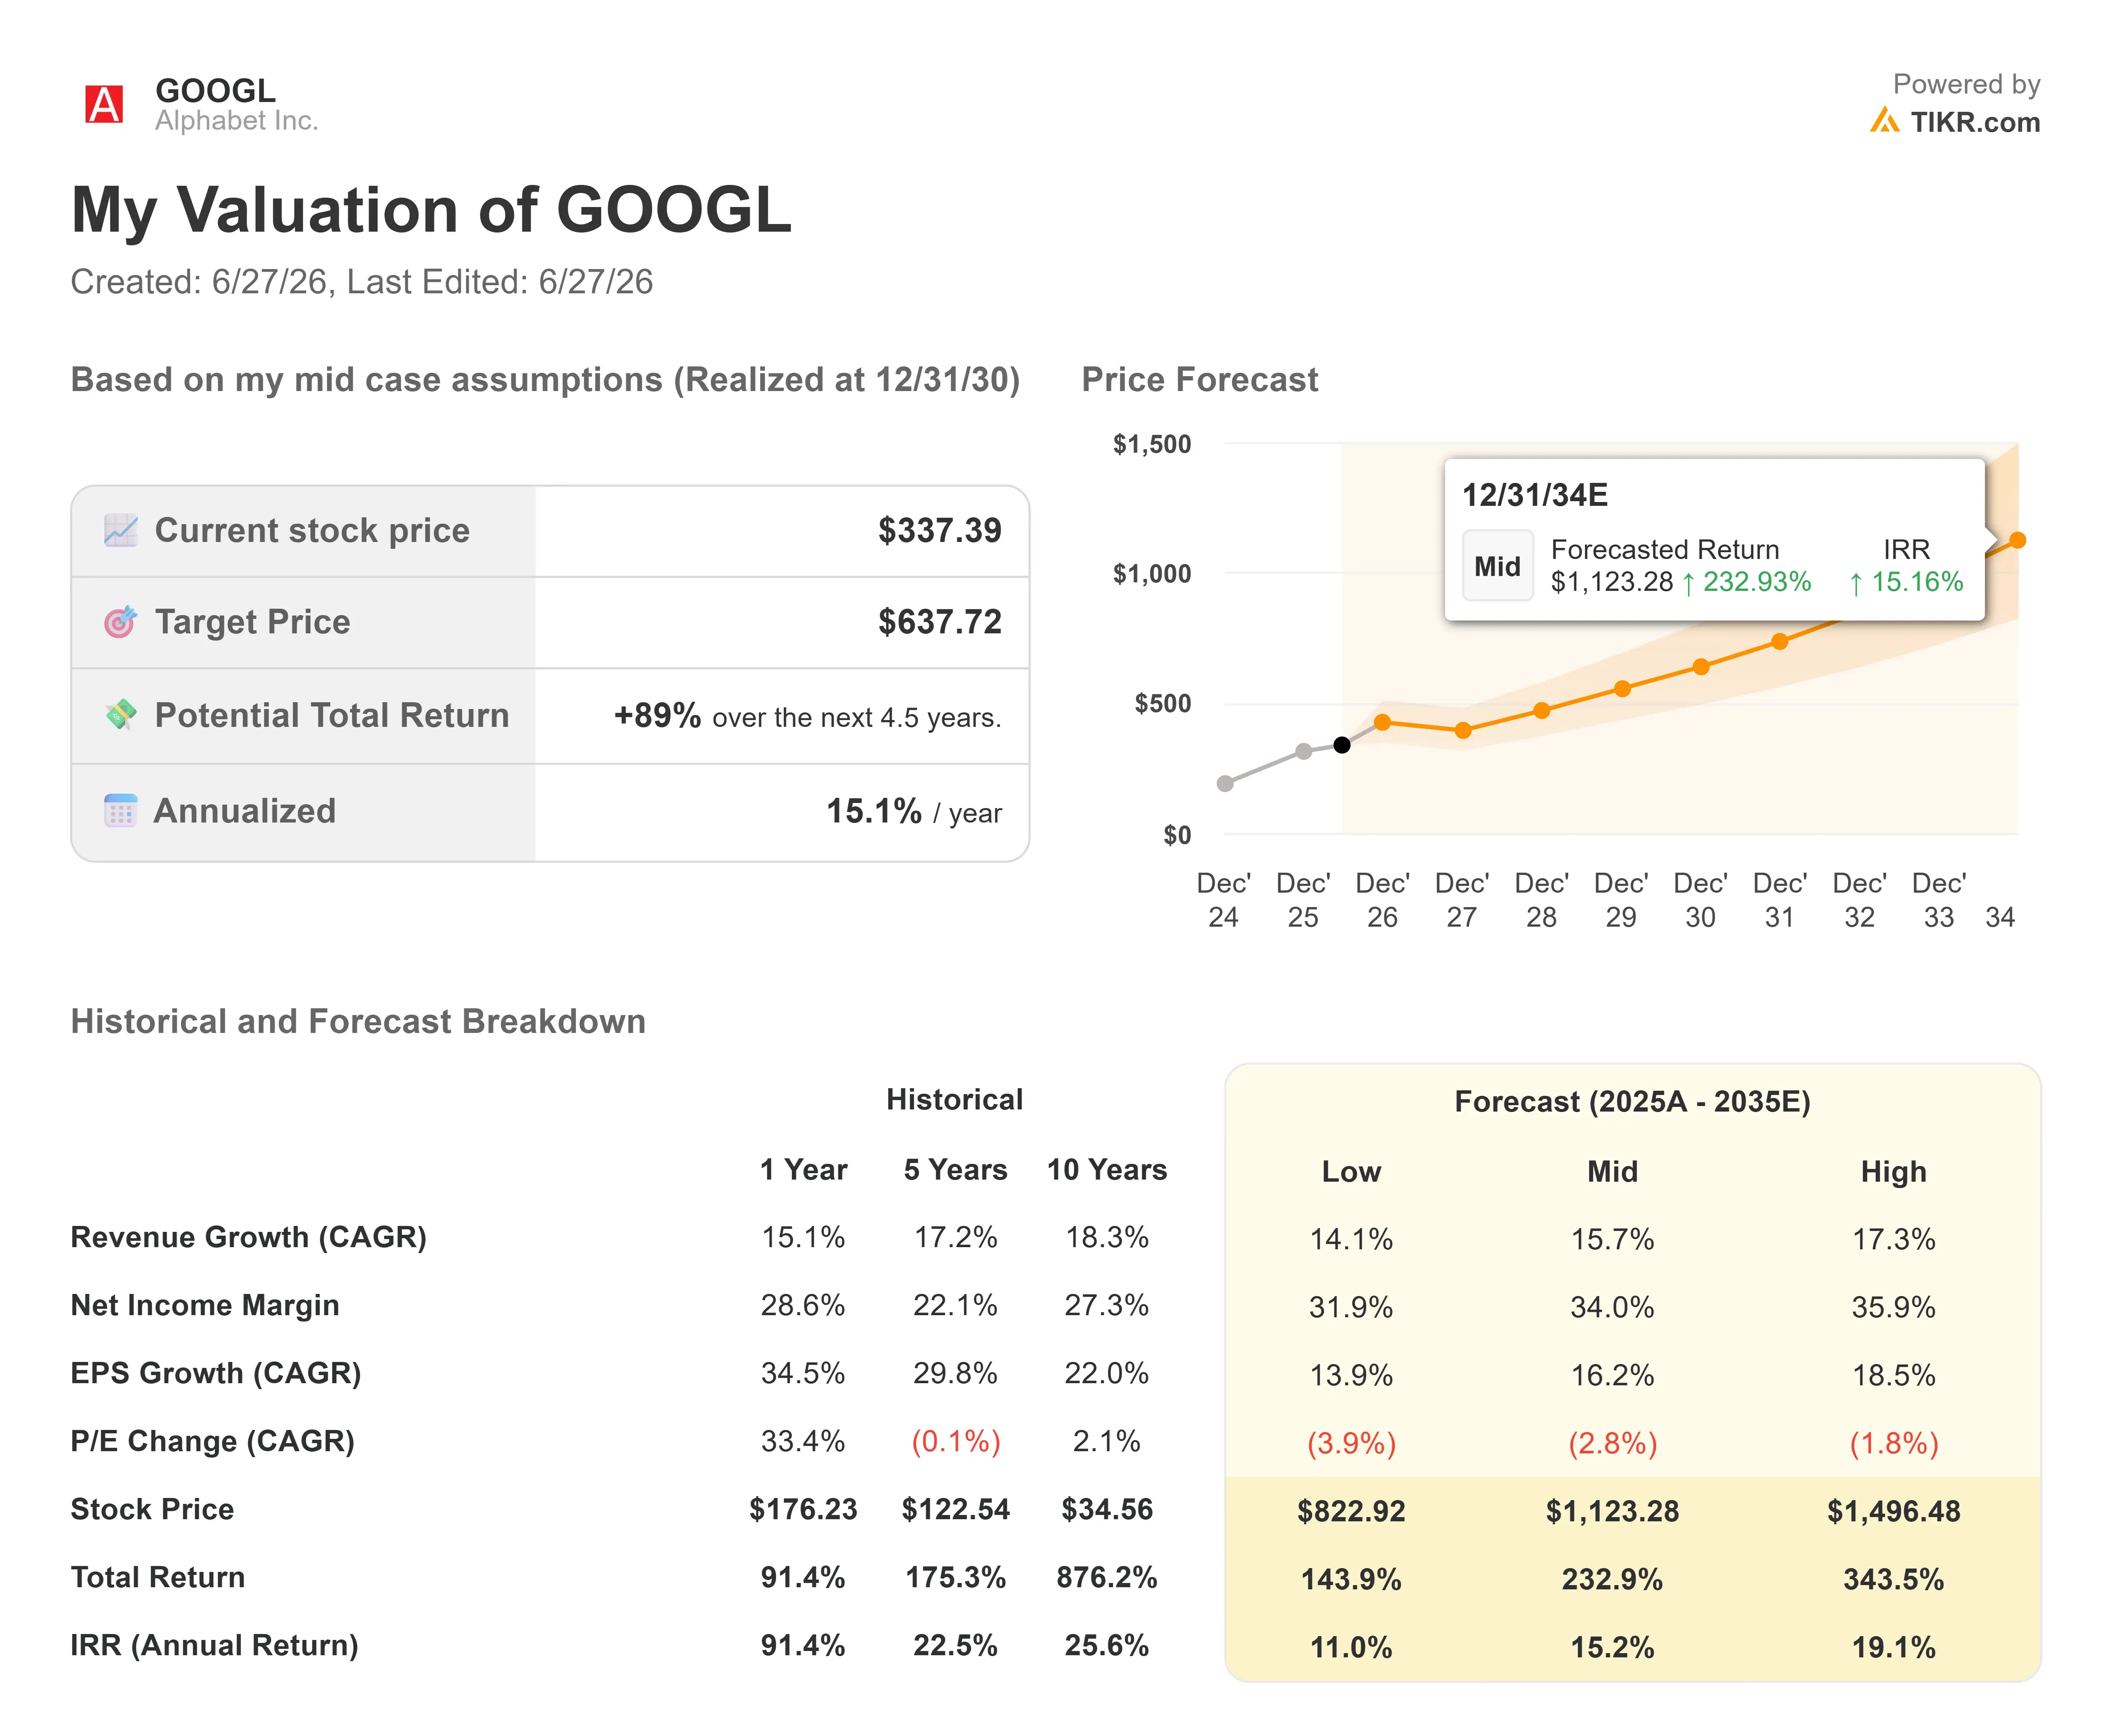
- Current Price: $337.39
- Target Price (Mid): ~$640
- Street Target: ~$430
- Potential Total Return: ~89%
- Annualized IRR: ~15% / year
- Earnings Reaction: +9.96% (April 29, 2026)
Now Live: Discover how much upside your favorite stocks could have using TIKR’s new Valuation Model (It’s free) >>>
What Happened?
Alphabet Inc. (GOOGL) just learned how quickly a talent story can become a stock story. Over six days in late June, five of Google’s most important AI researchers announced they were leaving for direct rivals. The market did not wait for the nuance. On June 22, the stock closed down about 5%, its worst single day in over a year, after touching an intraday loss of more than 7%. The single-session decline erased more than $200 billion in market value.
The names matter, which is why the reaction was so sharp. Noam Shazeer, co-lead of the Gemini model and a co-author of the 2017 transformer paper that underpins modern AI, left for OpenAI on June 18. The next day, John Jumper, a 2024 Nobel laureate in chemistry for his AlphaFold protein-folding work, announced he was joining Anthropic. Days later, three more Gemini contributors followed Jumper to Anthropic. For a company whose entire AI thesis rests on owning the best models, watching the people who built them walk to the competition is the kind of headline that moves a stock.
The timing made it worse. Google also pushed the general release of Gemini 3.5 Pro from June to July, citing quality refinements, just as the departures hit the wire. Even a clear positive landed flat: Alphabet joins the Dow Jones Industrial Average on June 29, replacing Verizon, and the inclusion did nothing to reverse the slide. When index membership cannot lift a stock, sentiment is doing the driving.
Why the market reaction may be overdone
Here is the tension. The narrative says Google is losing the AI race. The numbers say Google is having its best year in a decade. Both cannot stay true for long, and the gap between them is the opportunity.
Start with the scale of what is actually left. Five researchers are a real loss of prestige and institutional knowledge. It is not a material dent in a research organization that employs roughly 195,000 people across DeepMind and Google. The talent war is genuine, and a SignalFire study found DeepMind engineers move to Anthropic roughly 11 times more often than the reverse, a flow worth watching. One detail the headlines mostly skip: Alphabet is itself a major investor in Anthropic, so some of the value those researchers create lands back on its own balance sheet. The thesis that actually breaks Alphabet is sustained model underperformance, not a roster change. The early read on that question runs through the business, not the press releases.
And the business is accelerating. At a June 3 special call, CEO Sundar Pichai framed the moment in demand terms, not defensive ones. “We are experiencing strong demand for our AI solutions and services from enterprises and consumers at levels that are meaningfully exceeding our available supply,” he told investors. That single sentence reframes the entire capital story: Alphabet is supply-constrained, not demand-constrained, which is the position every AI company wants to be in.
The proof is in Google Cloud, Alphabet’s enterprise computing and AI segment. Cloud revenue grew 63% year over year in Q1 2026, and the backlog, meaning signed customer commitments not yet booked as revenue, nearly doubled in a single quarter to $462 billion. That backlog is larger than Alphabet’s entire annual revenue. CFO Anat Ashkenazi told investors that “just over 50%” of it converts to revenue within 24 months, which means more than $230 billion in contracted Cloud revenue is already scheduled to land by mid-2028. Customers do not commit at that scale to a company they think is losing.
The headline financials back it up. In Q1 2026, Alphabet reported $109.9 billion in revenue, up 22% year over year, with operating income up 30%. Net income of $62.6 billion beat estimates by 96.51%, per TIKR’s Beats and Misses data, and the stock rose 9.96% on the print. That was the fifth straight revenue beat, per the same data. The fear narrative is loud, but the earnings revisions have moved the other way.
The real near-term risk is not talent. It is cash. Alphabet is spending $180 billion to $190 billion on capital expenditures this year, with management guiding 2027 higher still, and it funded part of that with a roughly $85 billion equity raise in early June. That spending compresses free cash flow hard: TIKR’s consensus estimates show FCF margin dropping to around 5% in 2026 from about 18% in 2025, before recovering toward 8% in 2028 as the new infrastructure cycles through depreciation. Investors who owned Alphabet as a cash machine now own a heavy-capex growth story, and some are repricing it accordingly. That repricing, not the departures, is the substance under the selloff.
 Alphabet Drawdowns (TIKR)
  Alphabet Google Cloud Operating Revenue & Income (TIKR)
See historical and forward estimates for Alphabet stock (It’s free!) >>>
How the valuation stacks up against peers
Even after the AI build-out, Alphabet does not trade like a stock the market has given up on. GOOGL changes hands at around 27x NTM P/E and around 17x NTM EV/EBITDA, per TIKR. That is a premium to its closest peers: Meta Platforms (META) trades at around 17x NTM P/E and around 9x NTM EV/EBITDA, while Reddit (RDDT) sits at around 23x and 19x. The premium is real, but so is the reason for it. Alphabet runs a dominant Search franchise, the fastest-growing major cloud business, the largest video platform by revenue, and its own AI chips, all inside one enterprise value. A modest premium for that mix is defensible, not a value trap, especially with the multiple already compressed from its spring peak.
See how Alphabet performs against its peers in TIKR (It’s free!) >>>
TIKR Advanced Model Analysis
- Current Price: $337.39
- Target Price (Mid): ~$640
- Potential Total Return: ~89%
- Annualized IRR: ~5% / year
 Alphabet Advanced Valuation Model (TIKR)
See analysts’ growth forecasts and price targets for Alphabet stock (It’s free!) >>>
The TIKR Valuation Model mid-case points to a target of around $640 per share, realized by year-end 2030, for a total return of around 89% and an annualized IRR of around 15%. That is the case to use here, because it reflects Alphabet executing its plan without requiring heroic assumptions or a perfect AI outcome.
The two revenue drivers are Google Cloud and Search advertising. Cloud carries the $462 billion backlog and its 63% growth rate, giving it a compounding base of contracted demand. Search adds the AI Mode and agentic-commerce formats that are lifting revenue per query, with management noting room to monetize longer, more complex searches that were previously hard to serve ads against. The margin driver is Cloud operating leverage: segment margin expanded to 33% in Q1 2026 from a loss in 2022, and further gains follow as infrastructure utilization rises. The primary risk is the AI talent and model question. If Gemini’s quality gap to frontier rivals widens rather than closes, enterprise Cloud customers buying specifically for AI capability could slow, and the brain-drain narrative would gain real substance.
The upside: Cloud holds its growth rate, the backlog converts on schedule, and the model’s around $640 target proves conservative as free cash flow recovers into 2028.
The downside: the talent exodus signals a genuine model slip, Gemini 3.5 Pro disappoints at its July launch, and the capex keeps compressing cash with no offsetting acceleration.
Conclusion
The talent story will keep generating headlines, but the number that settles this debate is Google Cloud’s growth rate at Q2 2026 earnings in late July. The threshold is clean: Cloud holding above 50% growth with steady or expanding margins means the $462 billion backlog is converting, and the brain-drain fear is mostly noise. Cloud slipping toward the 30s while free cash flow stays compressed means the sellers had it right, and the model leakage is starting to show. The Q2 print arrives just after the delayed Gemini 3.5 Pro launch, so investors get the model and the metric in the same window. Watch both. One report will tell you whether the value the market erased was fear or foresight.
See what stocks billionaire investors are buying so you can follow the smart money with TIKR.
Should You Invest in Alphabet?
The only way to really know is to look at the numbers yourself. TIKR gives you free access to the same institutional-quality financial data that professional analysts use to answer exactly that question.
Pull up Alphabet, and you’ll see years of historical financials, what Wall Street analysts expect for revenue and earnings in the quarters ahead, how valuation multiples have moved over time, and whether price targets are trending up or down.
You can build a free watchlist to track Alphabet alongside every other stock on your radar. No credit card required. Just the data you need to decide for yourself.
Analyze Alphabet on TIKR Free →
Looking for New Opportunities?
- See what stocks billionaire investors are buying so you can follow the smart money.
- Analyze stocks in as little as 5 minutes with TIKR’s all-in-one, easy-to-use platform.
- The more rocks you overturn… the more opportunities you’ll uncover. Search 100K+ global stocks, global top investor holdings, and more with TIKR.
Disclaimer:
Please note that the articles on TIKR are not intended to serve as investment or financial advice from TIKR or our content team, nor are they recommendations to buy or sell any stocks. We create our content based on TIKR Terminal’s investment data and analysts’ estimates. Our analysis might not include recent company news or important updates. TIKR has no position in any stocks mentioned. Thank you for reading, and happy investing!
You May Also Like

Ethereum koers toont zeldzaam dubbel koopsignaal en richt zich op $4.550

Fed Day Dry Powder: Cryptoquant Analyst Tracks $7.6B Stablecoin Pile on Exchanges
Michael Saylor’s Bitcoin Treasury Strategy Has Finally Hit Its Breaking Point

