

Bitcoin Liquidation Cluster Builds Near $70.7K and $78K as Leverage Returns
Bitcoin liquidation clusters are thickening on either side of spot, with more than $1.64 billion in long liquidations stacked below $70,721 and over $1.25 billion in short liquidations piled above $78,068, as leverage creeps back into the market and traders brace for a two-sided squeeze.
Why the $70.7K and $78K liquidation zones matter for Bitcoin
A liquidation cluster is a price area where a large number of leveraged futures positions would be force-closed if spot trades through that level. CoinGecko’s Bitcoin market page, citing CoinGlass, flags two such pockets around current price: $1.64 billion in long liquidations below $70,721 and $1.25 billion in short liquidations above $78,068.
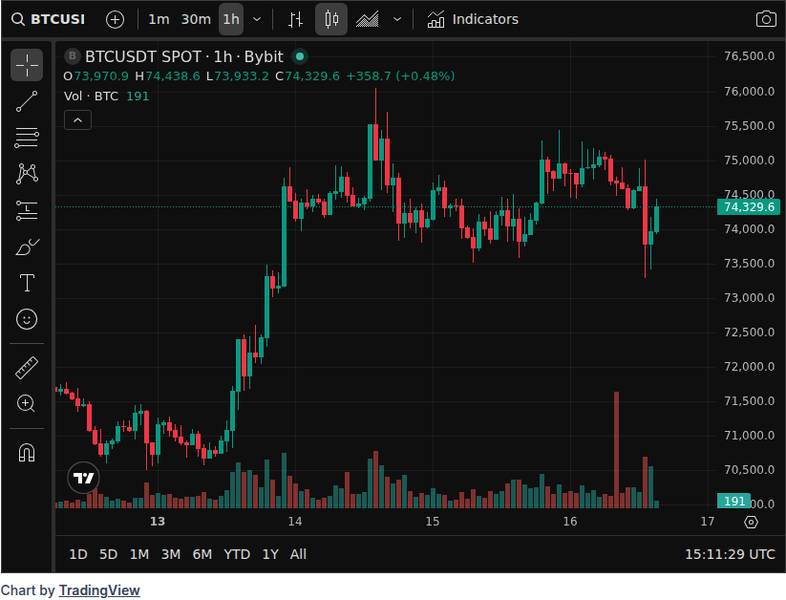 CoinGecko market data view included to frame the latest move in bitcoin.
Spot BTC is wedged between those walls at roughly $74,049, with a flat 24-hour change of about 0.02% and a market capitalization near $1.48 trillion on $42.4 billion of daily volume. The setup effectively maps two liquidity magnets just a few thousand dollars away in either direction.
Clusters like these tend to act as targets during volatile sessions, because forced unwinds feed back into price and accelerate moves once either threshold is breached. That dynamic is a recurring theme in recent BTC structure reads, including coverage of how Bitcoin has traded near its $78K true market mean ahead of Fed data.
What rising leverage says about current BTC market sentiment
Derivatives activity is ticking up alongside the cluster build. CoinMarketCap’s global metrics show 24-hour derivatives volume at roughly $732.3 billion, a 5.42% increase on the day, signaling that speculative positioning is being rebuilt rather than trimmed.
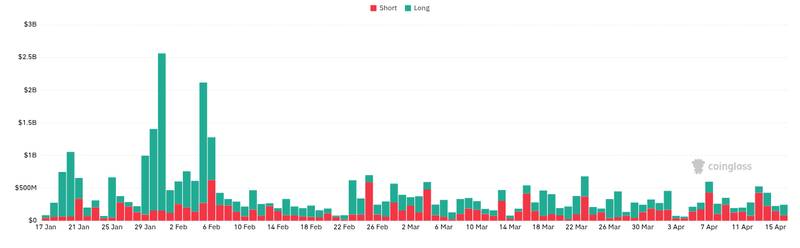 CoinGlass derivatives screen showing the positioning backdrop around bitcoin.
Sentiment, however, is not riding that leverage higher. The Alternative.me Fear & Greed Index prints 23, firmly in Extreme Fear, pointing to traders reaching for leverage even while broad conviction is weak. Rising leverage into a fearful tape is historically the condition most prone to violent squeezes in either direction.
Social data tells a similar story, with LunarCrush showing a Bitcoin galaxy score of 51.4 and an alt rank of 231, suggesting attention is lukewarm even as positioning gets heavier. That is the classic profile of a market where conviction lags exposure, a mismatch that typically resolves through a forced move rather than a drift.
How traders may read the next move between the two BTC liquidation clusters
The cluster map gives traders a straightforward short-term framework: a break below the lower zone risks cascading the $1.64 billion of trapped longs, while a push through the upper zone threatens to flush the $1.25 billion of shorts. Either way, the liquidation pockets themselves become the price objectives.
On-chain analyst _Checkonchain said on X that the market has already been through a “2-sigma long liquidation event” and warned a further wick into the $70K to $80K zone would not be surprising, identifying roughly $78K as the next support area, in comments highlighted by Cointelegraph.
The regulatory backdrop is not driving this particular setup; the pressure is coming from derivatives positioning and liquidity structure rather than policy catalysts. That puts the focus squarely on order books and funding, not headlines, even as sector news such as the SEC’s five-year relief for some self-custody crypto apps and debate over a yuan-backed stablecoin continues in the background.
With spot pinned near the midpoint and leverage rebuilding into Extreme Fear, the path of least resistance is whichever cluster gives way first. Traders watching this tape will likely key off the $70,721 and $78,068 thresholds as the trigger lines for the next impulsive move.
Disclaimer: This article is for informational purposes only and does not constitute financial or investment advice. Cryptocurrency and digital asset markets carry significant risk. Always do your own research before making decisions.


추천 콘텐츠

Trump's own pollster hits him with devastating prediction about key voting bloc: 'We lose'

Brazil targets crypto fraud with prison terms up to 10 years
Bitcoin Network Is Set to Experience One of the Largest Mining Difficulty Drops in Its History Today


인기 뉴스
더보기
