SUI Price Holds Near $0.70 as Analysts Target a Recovery Toward $0.84

Key Insights:
- SUI price is attempting to hold a long-term demand area around $0.67–$0.70.
- Analyst places the nearest recovery zone between approximately $0.78 and $0.84.
- Longer-term projections toward $6, $12.50 or $25 remain highly speculative and require several major breakouts.
SUI crypto is trading near $0.70 after months of selling pushed the token back toward a demand area that has repeatedly attracted buyers. Although the price of SUI has begun to move sideways, the broader trend is still below local resistance.
SUI Price Attempts to Build a Base Near $0.70
BitGuru identified the current structure as an accumulation phase following a prolonged decline. His four-hour chart places SUI near $0.69, directly above a support band around $0.68.
 SUIUSDT 4H Chart | Source: BitGuru, X
The market previously formed a short consolidation range before recovering toward $0.84. That move failed, sending the price back to the same lower support area. Buyers must now defend this zone to avoid another breakdown.
The first upside level sits near $0.78. A move through that barrier could reopen the path toward approximately $0.84, where the previous recovery stalled. Above $0.84, several resistance levels appear between $0.89 and $0.96. Price would need stronger volume and consecutive higher lows before those levels become realistic targets.
A decisive close below roughly $0.68 would damage the accumulation case. It could also expose SUI to lower prices before another base begins forming.
SUI Crypto Weekly Compression Supports a Reversal Attempt
Meanwhile, a weekly chart shared by Sui Community showed SUI trading during one of its tightest periods of price compression. The Bollinger bands are tightening up after months of low volatility.
 SUIUSD Weekly Chart | Source: Sui Community, X
Contracting bands often appear before a larger move, but they do not predict its direction. Sellers still have the edge, as SUI trades below the middle band and below the moving-average structure.
Additionally, the chart shows a potential bullish divergence in the Relative Strength Index (RSI) indicator. SUI price has been trading around its lows, and the RSI seems to be embarking on a slight bottom near oversold levels.
That divergence suggests downward momentum may be slowing. However, confirmation requires the price to move above its short-term descending trend line and reclaim the $0.80–$1 area.
A failure to hold the current support would invalidate the early reversal signal. Compression could then resolve lower rather than produce the projected recovery toward $3.00.
Cycle Comparison Produces a $12 Target
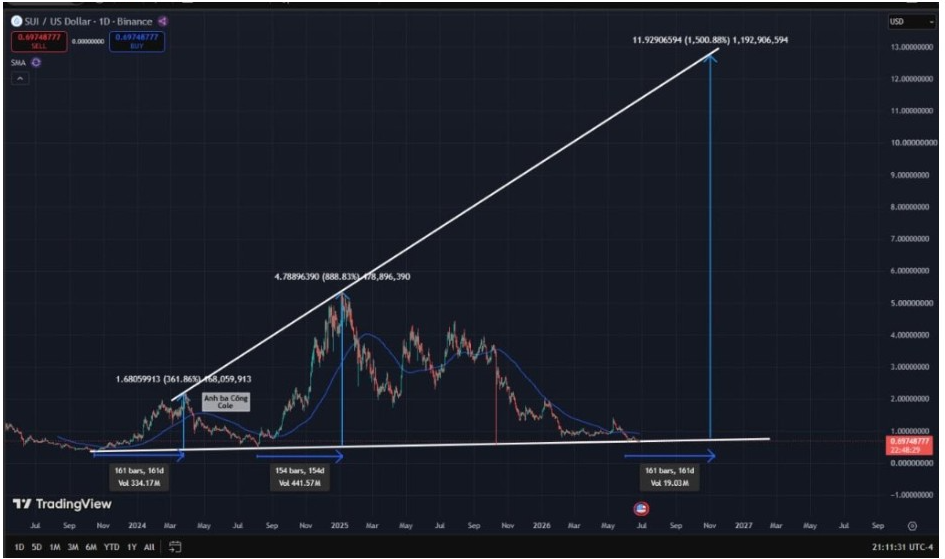
Additionally, Sui Intern shared a long-range comparison based on earlier SUI market cycles. The chart marks two historical periods lasting about 154 to 161 days before larger price expansions.
 SUIUSD Daily Chart | Source: Sui Intern, X
The first measured move reached roughly $1.68, while another advanced toward $4.79. The latest projection extends from the present base toward approximately $11.93, representing a gain near 1,500% from the chart’s starting level.
The accompanying post provides an even broader forecast of $12.50 to $25.79. Those figures are not current breakout targets. They assume that SUI crypto repeats earlier cycle timing and expands far beyond its former high.
Before the $11.93 area gains technical relevance, SUI would need to recover $1, clear $2, and break its previous major resistance between roughly $4 and $5.50. The projected range, therefore, illustrates a possible long-term scenario rather than a price level supported by the present market structure.
SUI Price Double-Digit Outlook Requires Confirmation
Notably, Top Gainer Today also expects SUI price to eventually enter double-digit territory. The shared chart shows price sitting on a horizontal demand area near $0.67 while remaining beneath two descending resistance lines.
 SUIUSDT Chart | Source: Top Gainer, X
The nearer trend line crosses around $0.80–$1. A break above it could support an initial recovery toward $2. The larger descending line lies closer to $2.50–$3 and serves as the main barrier to a broader trend reversal.
The chart then illustrated a move above $6, but no completed breakout currently supports that target. SUI remains close to its lower demand zone and has yet to reclaim even the first trend line.
The practical price map starts with $0.78–$0.84. A move above $1 would strengthen the base, while $2 and $3 would confirm a broader structural change. Only after those levels fall would forecasts above $6, $12, or $25 carry stronger technical weight. For now, $0.68 protects the setup, and $0.84 forms the first meaningful recovery test.
The post SUI Price Holds Near $0.70 as Analysts Target a Recovery Toward $0.84 appeared first on The Market Periodical.


추천 콘텐츠

AI spending boom accelerates as Big Tech pours trillions into infrastructure

Polymarket’s $3.3B World Cup boom exposes the longshot trap inside prediction markets