

Crude Oil Futures Chart: How to Read the Energy Market
If you want to trade global energy, the crude oil futures chart is your most important tool. It is not just a picture of past prices. It is a live map of human psychology, supply, and demand.
Many beginners look at a trading chart and feel confused by the green and red bars. In this guide, I will explain exactly how to read a crude oil futures chart. I will also show you how to spot macro trends and execute trades using MEXC.
The Anatomy of a Candlestick
Most professional traders use a "candlestick" chart (or K-line chart) to track oil prices. Each candlestick shows you the price action for a specific time period, like one hour or one day.
Every single candlestick gives you four critical pieces of data, known as OHLC:
Open: The price when the time period started.
High: The highest price reached during that time.
Low: The lowest price dropped to during that time.
Close: The final price when the time period ended.
If the Close is higher than the Open, the candlestick is green (Bullish). Buyers won the battle. If the Close is lower than the Open, the candlestick is red (Bearish). Sellers pushed the price down.
WTI vs. Brent on the Chart
When you open an exchange, you will see different charts for different types of oil. You must choose the right chart for your strategy.
If you are trading US economic data, you should open the WTI chart. If you are trading Middle East news, you should open the Brent chart. To understand why these two charts move slightly differently during a crisis, read our guide on the difference between WTI and Brent.
Interactive Chart Reading Simulator
The best way to understand a crude oil futures chart is to interact with one. Use the educational simulator below to see how candlesticks form. You can trigger different macro events to see how the chart reacts in real time.
Hover over the candles to read the exact Open, High, Low, and Close data.
Why 24/7 Chart Access Matters
Traditional commodity markets close on Friday evening. They do not open again until Monday morning. This creates a massive problem.
If a war starts on Saturday, the oil price will gap up massively. Traditional traders cannot see this on their charts or protect their money until Monday. By then, it is too late.
This is why modern traders use synthetic derivatives. If you want to know how this works behind the scenes, read what are crypto crude oil futures. Because crypto exchanges never sleep, your WTI and Brent charts update 24 hours a day, 7 days a week. You can see the price action the exact second a news story breaks.
Execute Your Strategy on MEXC
Once you know how to read the chart, it is time to trade. If you are ready to learn how to trade crude oil with USDT, MEXC provides the ultimate platform.
Here is why you should trade oil on MEXC:
0% Trading Fees: Every time a candlestick closes, you can enter or exit a trade without paying high broker commissions.
200x Leverage: You can use a small amount of capital to catch big profits from minor chart breakouts.
Deep Liquidity: MEXC offers institutional-grade order books. This means your market orders execute instantly, exactly where you see the price on the chart.
Do not trade blindly. Learn the chart, manage your risk, and trade the global energy market with confidence. Log in to MEXC, open the USOIL or UKOIL chart, and start catching the next big macro trend today.
Popular Articles
View More
SK Hynix Stock: Is the AI Memory Trade Still Running?
SK Hynix stock has become one of the most watched names in the AI hardware boom. The company is no longer being valued only as a traditional memory-chip producer. Traders are now treating it as one
America 250 Coin: Commemorative Coin, Crypto Narrative, or RWA Trade?
America 250 Coin is not just a coin-collector search term. In 2026, it sits at the intersection of U.S. history, commemorative coinage, precious metals, tokenized real-world assets, and speculative

How to Use Technical Indicators in Stock Trading: When MACD, RSI, and Moving Averages Help (or Trap You)
For many beginner traders, discovering technical indicators feels like finding a cheat code to the stock market. You load up a chart, overlay the MACD, add an RSI, plot three moving averages, and
Stock Trading Risk Management: Position Sizing, Stop-Loss Rules, Take-Profit Plans, and Trading Journals
Anyone can press a button and buy a stock. However, what determines how long you survive in the market is not the accuracy of your analysis when you buy, but how you control your losses when you are
Hot Crypto Updates
View More
Is BEEG Dead in 2026? On-Chain Data Tells a Very Different Story
Is BEEG dead in 2026? This deep-dive into Beeg Blue Whale (BEEG) on-chain data, holder structure, and Sui ecosystem tailwinds reveals the real story behind the 98% crash — and why MEXC is the best

What Is Jable.tv? The Truth Behind the Name — and Why It Matters in 2026
What is Jable.tv? The adult JAV streaming site with 51M monthly visits has nothing to do with the JAB crypto token — but in 2026, that name collision is fueling a dangerous wave of phishing attacks.

OpenAI vs Anthropic IPO Race: Who Rings the Bell First at Nearly $1 Trillion?
OpenAI filed its confidential S-1 on May 22 and Anthropic followed on June 1, 2026. With combined valuations approaching $2 trillion, this is the biggest AI IPO wave in history. Here is everything

Trending News
View More
HKTDC’s Fashion Hong Kong Paris Promotion Concludes, Strengthening Global Reach for Local Brands
Hong Kong Trade Development Council (HKTDC) and Hactl collaborate at Paris Men's Fashion Week to showcase Hong Kong designers, boost global expansion, and promote
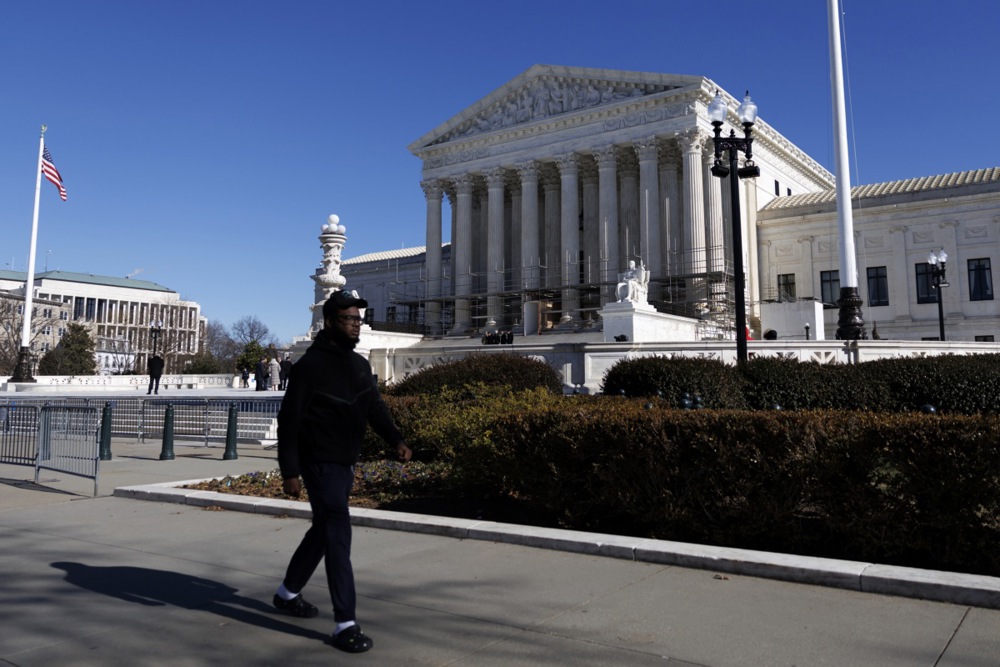
US Supreme Court rules Trump can fire Federal Trade Commission official
The decision is also expected to give the US president greater hiring and firing authority at agencies beyond the FTC.

Related Articles
View More
XRP Price Analysis: Can XRP Hold Support After the Pullback?
XRP is trading near a key short-term zone after losing momentum over the past week. As of June 29, 2026, the MEXC XRP price page shows XRP near $1.04, down around 0.88% over 24 hours and roughly 9.67%
United States Water Reserve (USWR): What Traders Should Know Before Chasing the Water RWA Narrative
United States Water Reserve (USWR) sounds like the kind of project name that can quickly attract attention: water, national resources, scarcity, and real-world assets all in one phrase. That combinati
SK Hynix Stock: Is the AI Memory Trade Still Running?
SK Hynix stock has become one of the most watched names in the AI hardware boom. The company is no longer being valued only as a traditional memory-chip producer. Traders are now treating it as one of


