

Bitcoin (BTC) and XRP Resume Price Crash: A 50% Dip From Here Could Make Sense
Bitcoin price is holding around $61,000 at the time of writing, and XRP is trading near $1.10. Both assets have been struggling to find their footing, and anyone watching the charts closely will notice that the BTC price direction has a way of pulling the Ripple token along with it. The question to address now is how far the dips could actually go.
The pressure on Bitcoin price did not come out of nowhere. Following the downing of a U.S. Apache helicopter, the United States carried out retaliatory airstrikes on Tuesday night, targeting Iranian military installations. Iran then responded in the early hours of Wednesday, June 10, launching a 21-strike ballistic missile and drone barrage that hit bases hosting U.S. personnel in Kuwait, Bahrain, and Jordan.
When military hostilities of that scale erupt, institutional trading algorithms move almost immediately into defensive mode. Bitcoin is viewed by these systems the same way tech stocks are viewed, as a risk asset. Trading desks sold BTC alongside equities, and the Bitcoin price dropped to an intraday low of $60,756 on Tuesday.
The conflict also erupted adjacent to the Strait of Hormuz, a critical maritime chokepoint that handles 20% of global oil shipments. Any credible threat to energy supply creates an oil-driven inflation risk. Higher energy costs push the Federal Reserve toward keeping interest rates elevated for longer, and that kind of macro environment squeezes crypto market liquidity hard.
Nasdaq also composite fell more than 3% intraday on the back of macro risk aversion on June 9. Coinbase stock fell 4.1% and Strategy dropped 8% on the same day.
The outbreak of direct military conflict also coincided with an aggressive new wave of U.S. crypto sanctions targeting Iranian-linked networks. Major institutional market makers pulled back their buy orders out of concern over emergency wallet freezes and asset seizures.
AI Investment Frenzy and ETF Outflows Are Draining Liquidity From the BTC Market
There is a broader structural pressure working against Bitcoin right now that goes beyond any single news event. Speculative capital is moving away from crypto toward AI-related investments and high-profile tech offerings like the SpaceX IPO. Even Bitcoin miners are redirecting their physical infrastructure and energy data centers toward AI computing instead of crypto mining.
Spot Bitcoin ETFs have recorded $1.89 billion in net outflows in June 2026 alone. That kind of sustained institutional selling has stripped BTC of the baseline demand that was supporting its price during the ETF inflow cycle of 2024 and 2025. Without that floor, the Bitcoin price becomes much more vulnerable to external shocks like the ones seen this week.
Read Also: Claude AI Predicts the XRP Price if the US and Iran Sign a Peace Deal in June
Bitcoin Price Outlook: How Low Can Price Go This Cycle?
The Bitcoin price found a short-term bottom around $59,000 last week before bouncing back toward $64,000. That recovery did not hold. BTC has since pulled back and is currently trading around $61,200.
A clean break above $64,300 would flip the short-term outlook bullish and open the door to further gains. If neither buyers nor sellers can take control, the BTC price could spend some time ranging between $60,500 and $64,000. A drop below $60,500 is the bearish scenario, and it would likely push the price back toward last week’s low around $59,000.
A Long-Term Trend Line Going Back Years Could Send BTC Price as Low as $30,000
The bigger picture for Bitcoin price tells a more sobering story. Looking at the long-term chart, BTC has been bouncing off an ascending trend line for many years. The price bounced from that trend line back in 2017. It bounced off it again in 2020. It followed the same line after its 2021 all-time high, and it bounced off it once more in January 2023 after a prolonged bear market.
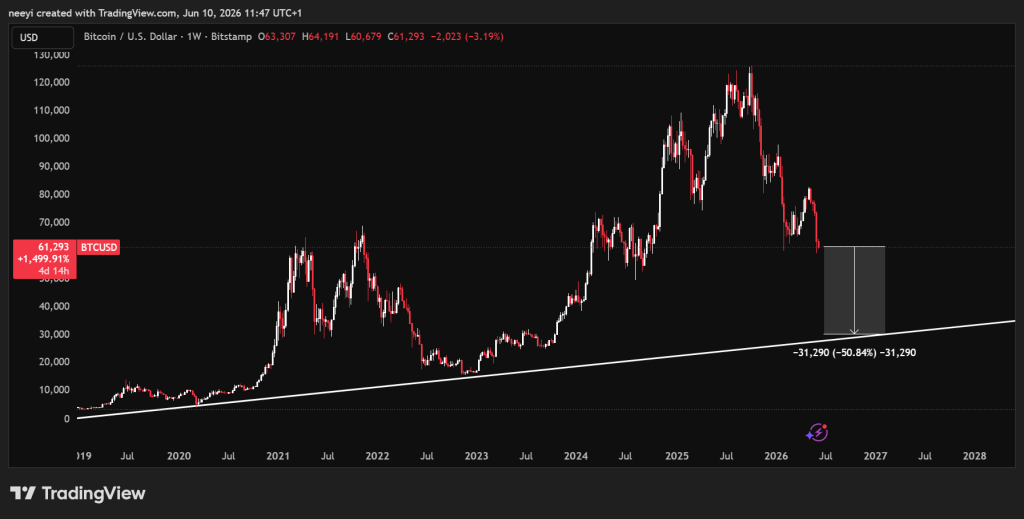 BTC Price Chart / TradingView.com
Bitcoin made a new all-time high around December 2025. If the historical pattern holds, the price could eventually revisit that same ascending trend line before the next major recovery gets underway. Based on where that trend line is projected to sit in the current cycle, a move as low as $30,000 is technically possible before any sustained reversal takes hold.
That does not mean $30,000 is a certainty. What the historical data does show is that this trend line has acted as the floor during every major Bitcoin bear market for nearly a decade. Dismissing it completely would mean ignoring one of the most consistent patterns in the BTC price chart.
Read Also: ChatGPT Predicts the Bitcoin Price if the US and Iran Sign a Peace Deal in June
XRP Price Outlook: How Low Can Price Go This Cycle?
The Ripple token is running a very similar script to Bitcoin at the moment. XRP price bottomed around $1.05 last week before bouncing back to approximately $1.18. That recovery has since reversed, and XRP is now trading near $1.10.
The key levels to watch are $1.10, $1.11, $1.14, and $1.18. A dip toward $1.10 looks likely in the near term if buyers fail to step in. A move back above $1.14 would improve the short-term picture and increase the chances of XRP reclaiming $1.18. A break below $1.10 opens the door toward last week’s low near $1.05.
A Long-Term Trend Line Going Back Years Could Send XRP Price as Low as $0.5
The longer-term XRP price chart tells a story worth paying close attention to. The Ripple token has not been forming clean higher highs in the way a confirmed uptrend would typically show. What it has done, however, is produce higher lows consistently since 2017.
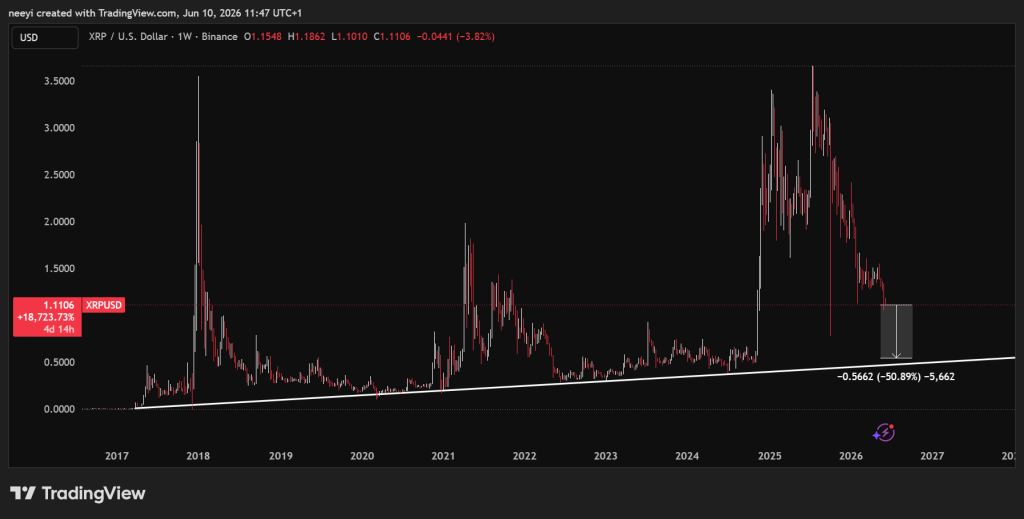 XRP Price Chart / TradingView.com
The price bounced off a rising trend line in 2017, again during the March 2020 crash, in June 2020, January 2021, and multiple additional times through August 2024.
That same trend line could still serve as the bear market floor in this cycle. Based on its current trajectory, a move as low as $0.50 is technically plausible before a major reversal takes place. XRP has bounced from similar structural levels before, and that long-term support zone carries real historical weight.
FAQs
Subscribe to our YouTube channel for daily crypto updates, market insights, and expert analysis.
The post Bitcoin (BTC) and XRP Resume Price Crash: A 50% Dip From Here Could Make Sense appeared first on CaptainAltcoin.


You May Also Like

XRP ETFs Lead Inflows While BTC, ETH Funds Bleed Capital

Crypto News: Pepeto Gains Traction While ADA and BNB Struggle to Keep Up

Mastercard Just Built A Payment Network For AI Agents — And It Runs On Crypto


