

Here’s Why Ethereum Price May Crash to $1,000 This Year
Key Insights
- Ethereum price has formed an inverted cup-and-handle pattern.
- This pattern often leads to more downside, potentially to $1,000.
- Ethereum’s key fundamentals in key areas like DeFi and RWA have worsened.
Ethereum price remained under pressure this year as both technical indicators and network fundamentals deteriorated. ETH traded near $1,665 on Friday, down roughly 50% from its yearly high. The token also hovered close to its lowest level since April 2025, keeping traders focused on downside risks.
Ethereum Price Pattern Signals Further Weakness
ETH price dropped to $1,665 and this may continue in the coming weeks or months. A closer look shows that the token has formed an inverted cup-and-handle pattern, a common bearish continuation sign.
The upper side of this pattern is at $2,455, while the lower side is at $1,800, giving it a height of $655. In the C&H pattern, the target is calculated by subtracting the height from the cup’s lower side. If this happens, it means that the coin may drop to $1,155. A move below that level will point to more downside, potentially to the psychological level of $1,000.
Other technicals suggest that the ETH price has more downside in the near term. It is slowly forming the risky bearish pennant pattern, which is now in the triangle section.
Ethereum token has also remained below the 50-day and 100-day Exponential Moving Averages (EMA). In this case, a rebound will only be confirmed when the coin moves above these averages.
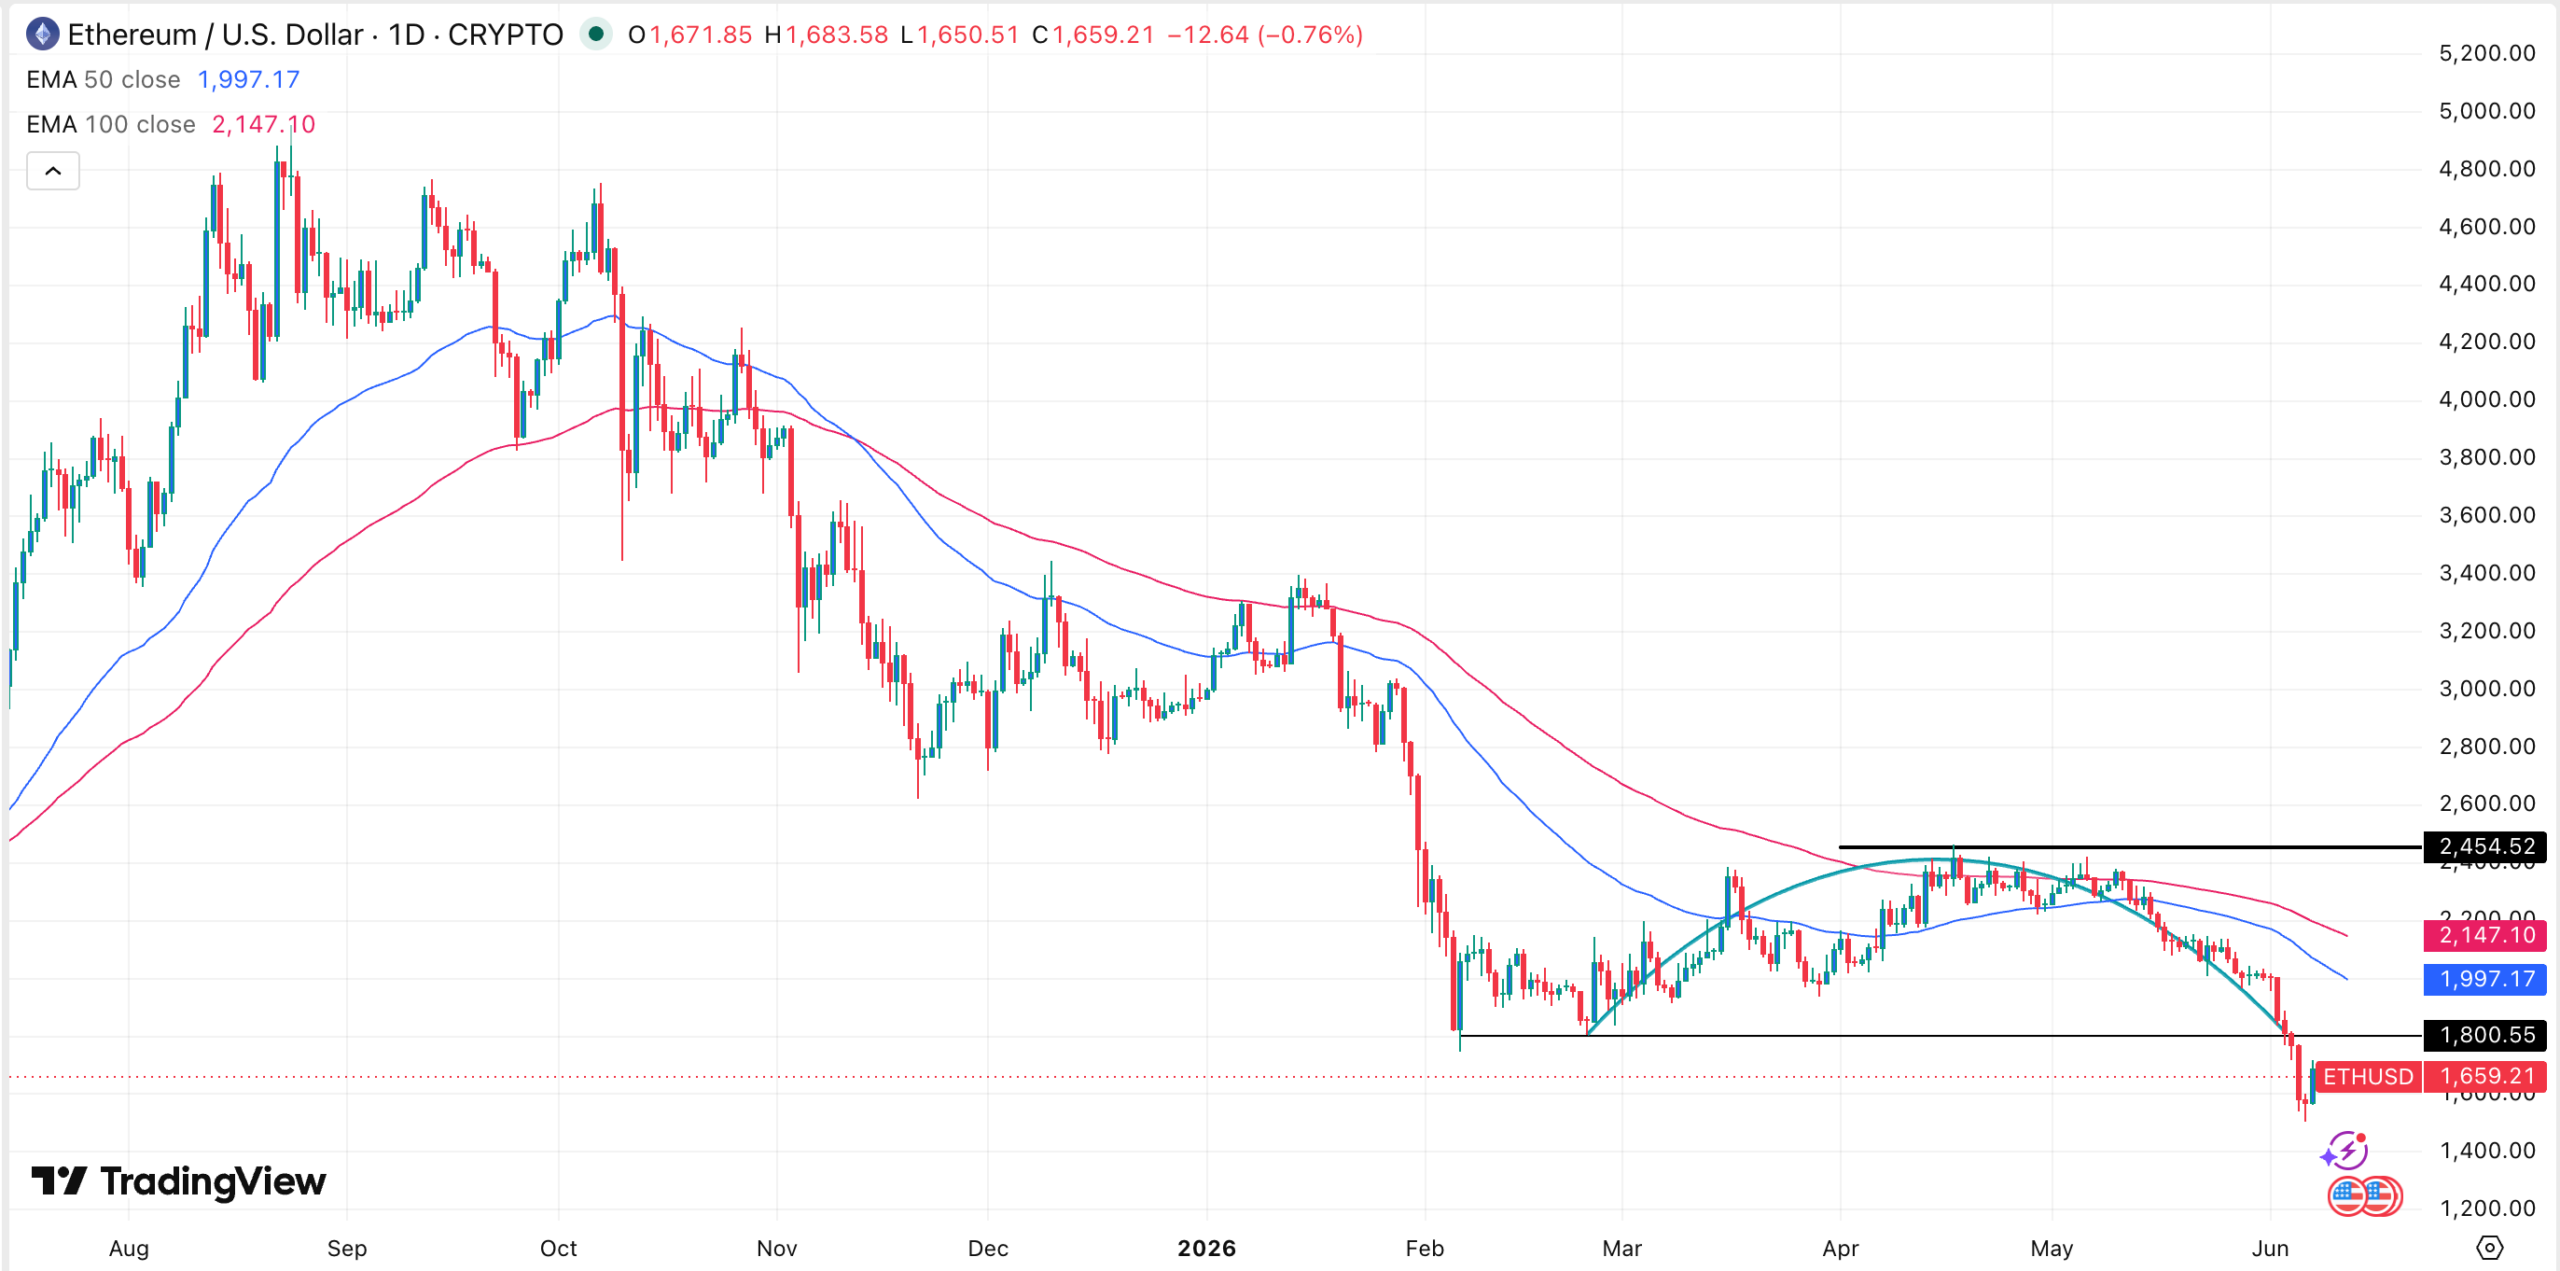 ETH price chart | Source: TradingView
Ethereum ETF Outflows Continue
The main bearish catalyst for the ETH coin is that American retail and institutional investors have continued dumping their ETFs. Data reveals that spot ETH ETFs shed over $15 million on Thursday, continuing a daily trend that started on June 9.
These funds have lost assets in the last five consecutive weeks, bringing the monthly outflows to over $183 million. They lost over $540 million in assets in May, with the year-to-date outflows jumping to over $1 billion.
The iShares Ethereum ETF (ETHA) now has over $4.7 billion net assets, while Grayscale’s ETH and ETHE have $1.47 billion and $1.31 billion.
 ETH staking inflows | Source: StakingRewards
The only positive is that data shows that investors are adding assets to their staking pools. They added over 834k ETH tokens worth over $1 billion in the last 30 days. This increase is likely because of the ongoing staking by Tom Lee’s BitMine.
Ethereum Fundamentals Have Waned
Another key bearish catalyst for Ethereum is that its fundamentals are no longer how they were a few months or years ago. At its peak, Ethereum was the biggest player in key areas in the crypto industry.
While its market share has remained, its role has continued to wane, which is translating to the fees it generates. For example, the total value locked (TVL) has plunged to $37 billion, down from $95 billion a few months ago.
Lido’s TVL has dropped by 25% in the last 30 days. Similarly, networks like Aave, Spark, EigenCloud, Morpho, Ether.fi, and Grove Finance have all plunged by over 20% in the last 30 days.
A good example of this is in the DEX industry, where it has been dethroned by Hyperliquid. Hyperliquid handled over $240 billion in the last 30 days. In contrast. Ethereum, on the other hand, handled just $37 billion in this period.
The same slowdown is happening in the real-world asset (RWA) tokenization industry. Its distributed asset value has dropped by 7% in the last 30 days to over $16 billion.
All this is showing in the amount of fees it makes. For example, data shows that the network made just $5.59 million this month, down from $16 million last month. The monthly fees have been plunging after peaking at $41 million in October last year.
The post Here’s Why Ethereum Price May Crash to $1,000 This Year appeared first on The Market Periodical.


You May Also Like

A quiet transformation is reshaping modern finance

AI Agent Accounts Meet DeFi: The Next Risk Layer Is Authorization, Not Yield

Bitcoin treasury sell-off accelerates as Riot, Bhutan, and public companies exit positions


