

Crypto Price Prediction for Today, June 13: Bitcoin (BTC), XRP, and Bittensor (TAO)
Bitcoin, XRP, and Bittensor have spent much of the past week moving sideways. Price action has lacked strong conviction in either direction, and that has left several key support and resistance levels in focus.
The interesting part is that all 3 assets are showing a similar pattern. Momentum indicators are beginning to improve, but broader trend indicators still point to caution.
That creates a situation where a single breakout could change the picture quickly. Until that happens, traders are watching major price levels to determine whether the next move will be a recovery or another leg lower.
Bitcoin Price Continues To Hold Within A Well-Defined Trading Range
The Bitcoin price outlook has changed very little since June 4. BTC has spent most of that period trading between $60,630 and $64,400.
Other important levels remain at $59,140 on the downside and $66,620 on the upside.
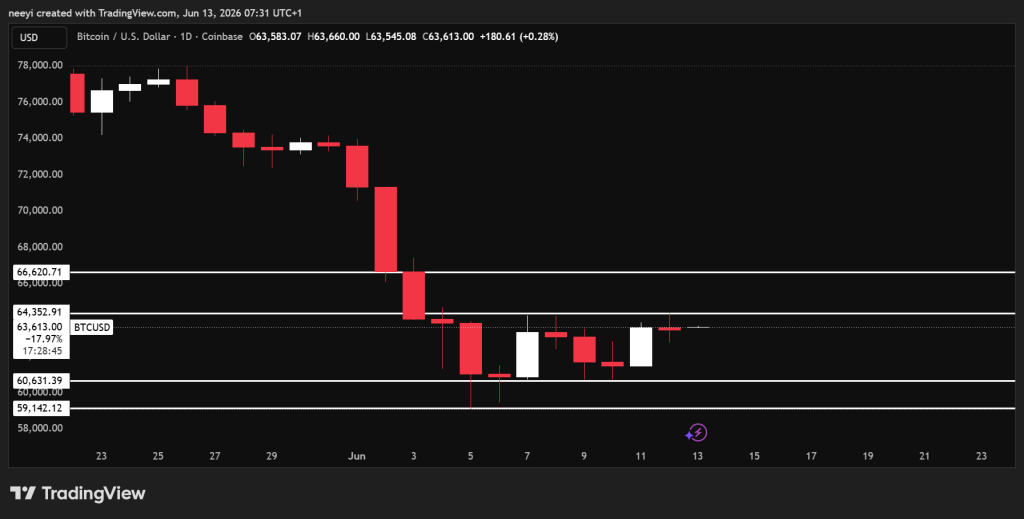 BTC Price Chart / TradingView.com
A look at the technical indicators shows a mixed picture.
The Relative Strength Index sits at 33. That reading remains in neutral territory, although it is approaching oversold conditions. Buyers could become more active if the indicator moves lower.
The Stochastic %K reading stands at 29. This also points to neutral conditions. Price is near the lower end of its recent range, but the indicator has not yet confirmed a strong reversal.
Momentum shows a reading of -531 and currently generates a buy signal. That suggests selling pressure may be easing even though price remains trapped inside the range.
The MACD level stands at -3,613 and continues to generate a sell signal. This indicates the broader trend remains weak despite recent stabilization.
Williams Percent Range is at -71. The indicator remains neutral and shows BTC is trading closer to support than resistance.
| Indicator | Value | Action |
|---|---|---|
| Relative Strength Index (14) | 33 | Neutral |
| Stochastic %K (14, 3, 3) | 29 | Neutral |
| Momentum (10) | -531 | Buy |
| MACD Level (12, 26) | -3,613 | Sell |
| Williams Percent Range (14) | -71 | Neutral |
Bitcoin Price Prediction For Today Depends On A Breakout Or Breakdown
The bullish scenario begins if Bitcoin breaks above $64,400. Such a move would show buyers have regained control and could open the path toward $66,600.
The neutral scenario remains the most obvious outcome for now. Bitcoin could continue trading between $64,400 and $60,630 for the rest of the day if volume remains subdued.
The bearish scenario develops if BTC falls below $60,630. That would expose the next major support level near $59,140.
XRP Price Remains Trapped Between Key Support And Resistance Levels
The XRP price outlook looks very similar to Bitcoin. Ripple’s token currently trades around $1.13 and has remained inside a broad range since June 5. Most trading activity has occurred between $1.08 and $1.16.
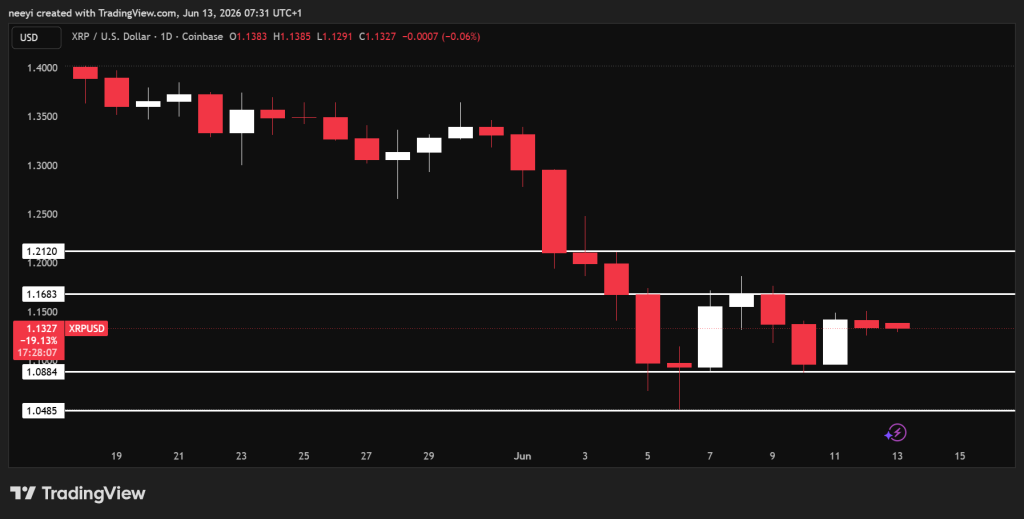 XRP Price Chart / TradingView.com
Technical indicators once again show conflicting signals.
The Relative Strength Index stands at 35.08. That reading remains neutral and indicates XRP is approaching oversold territory without reaching it.
The Stochastic %K reading comes in at 27.50. This remains neutral and shows XRP is still trading near the lower end of its recent range.
Momentum produces a buy signal with a reading of -0.06845. This indicates downside pressure may be weakening.
The MACD level remains negative at -0.06459 and continues to flash a sell signal. Trend strength remains weak despite recent stabilization.
Williams Percent Range stands at -72.67. This neutral reading suggests XRP remains closer to support levels than resistance.
| Indicator | Value | Action |
|---|---|---|
| Relative Strength Index (14) | 35.07982 | Neutral |
| Stochastic %K (14, 3, 3) | 27.50150 | Neutral |
| Momentum (10) | -0.06845 | Buy |
| MACD Level (12, 26) | -0.06459 | Sell |
| Williams Percent Range (14) | -72.67175 | Neutral |
XRP Price Prediction For Today Hinges On The $1.16 Resistance Level
The bullish scenario emerges if XRP breaks above $1.16. Such a move could push the XRP price toward the $1.20 area.
The neutral scenario keeps XRP trading between $1.08 and $1.16. Recent price action supports this possibility because neither buyers nor sellers have managed to establish dominance.
The bearish scenario comes into focus if XRP drops below $1.08. That would open the door for a move toward $1.04.
Bittensor Price Shows Little Momentum As TAO Stays Range Bound
The TAO price has not shown strong bullish or bearish momentum recently. Bittensor has remained range bound since June 5, and that pattern could continue unless fresh market participation enters the picture.
The main trading range remains between $192 and $217.
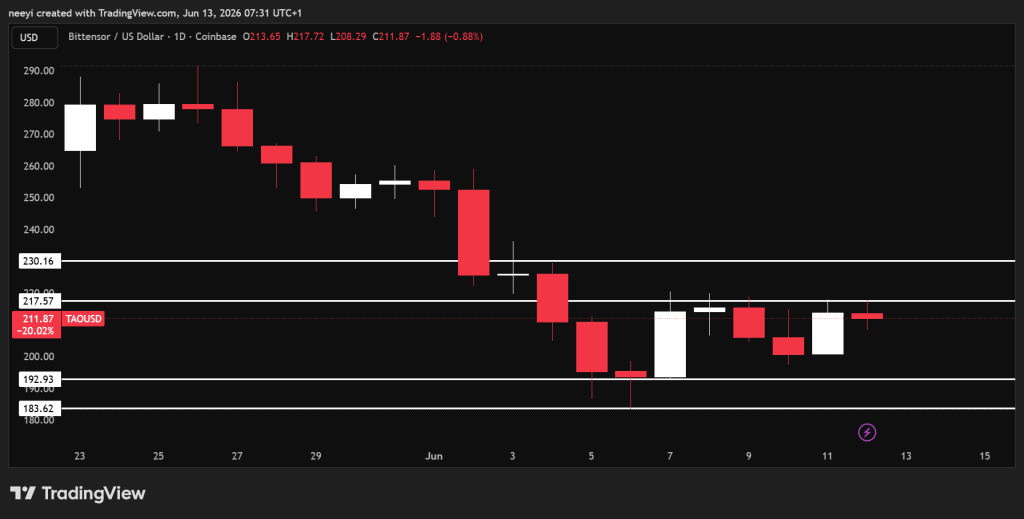 TAO Price Chart / TradingView.com
Indicator readings once again reveal a mixed setup.
The Relative Strength Index sits at 38.89. This remains neutral and suggests selling pressure has eased compared to previous weeks.
The Stochastic %K reading stands at 31.96. Neutral conditions remain in place as TAO trades near the middle of its recent range.
Momentum shows a reading of -13.73 and currently generates a buy signal. This suggests downside momentum may be fading.
The MACD level sits at -17.79 and continues to generate a sell signal. Trend weakness remains visible despite the recent stabilization.
The Ultimate Oscillator reading stands at 48.87. This neutral reading shows neither buyers nor sellers currently hold a decisive advantage.
| Indicator | Value | Action |
|---|---|---|
| Relative Strength Index (14) | 38.89 | Neutral |
| Stochastic %K (14, 3, 3) | 31.96 | Neutral |
| Momentum (10) | -13.73 | Buy |
| MACD Level (12, 26) | -17.79 | Sell |
| Ultimate Oscillator (7, 14, 28) | 48.87 | Neutral |
Bittensor Price Prediction For Today Depends On Whether TAO Escapes Its Range
The bullish scenario appears if TAO breaks above the $217 resistance level. Such a move could allow the Bittensor price to climb toward $230.
The neutral scenario keeps TAO trading between $192 and $217. Current market conditions support this possibility because volatility remains limited.
The bearish scenario develops if TAO falls below $192. That would expose the next downside target near $183.
FAQs
Subscribe to our YouTube channel for daily crypto updates, market insights, and expert analysis.
The post Crypto Price Prediction for Today, June 13: Bitcoin (BTC), XRP, and Bittensor (TAO) appeared first on CaptainAltcoin.


You May Also Like

Tether Freezes Millions as Mystery Tron Transaction Sparks Investigation

Roku Stock Jumps 20% — Is a Sale Coming?

Is Bitcoin Core 31.0 Safe? Privacy Bug Explained, Fix Coming in 31.1


