

Ethereum price today: ETH below all moving averages as fear hits 12

Trading at $1,658.77 as of June 25, 2026, the Ethereum price today reflects a market that cannot seem to find its footing. ETH sits below every major daily moving average while Bitcoin dominance climbs above 56%, leaving altcoins starved of capital and bulls with almost nothing to work with.
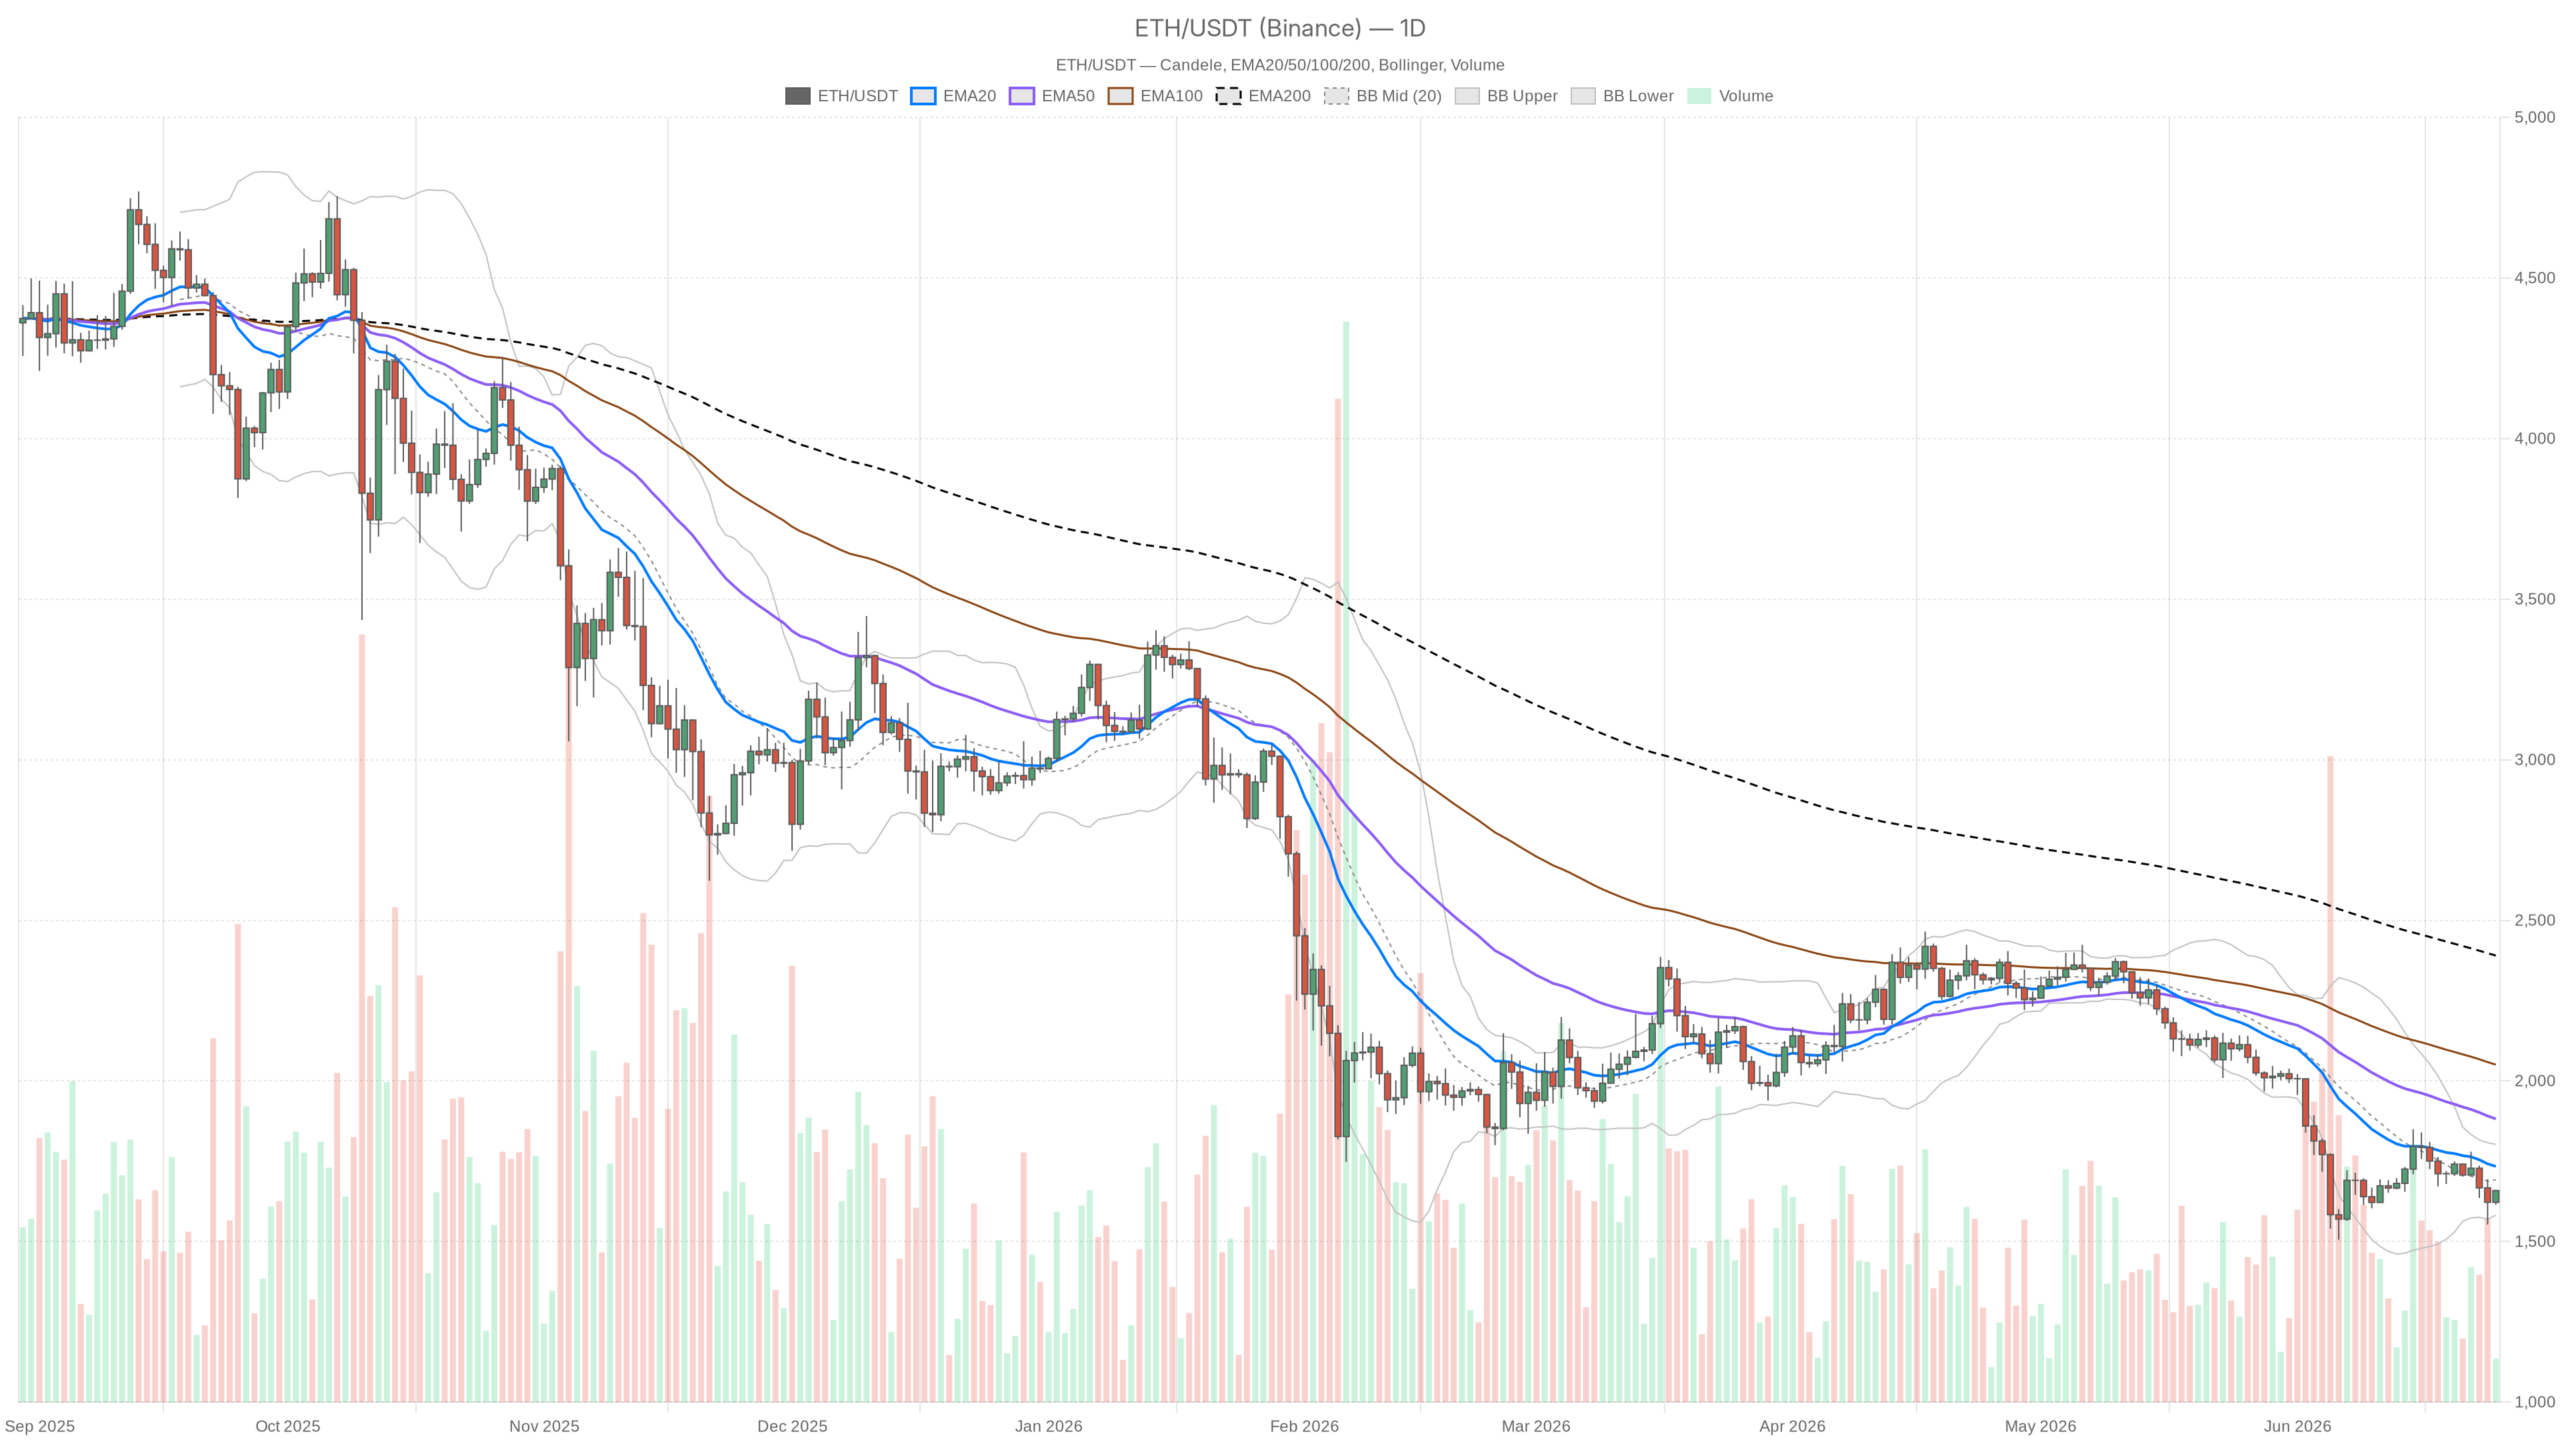 ETH/USDT — daily chart with candlesticks, EMA20/EMA50 and volume.
Key takeaways
- Ethereum trades at $1,658.77 on June 25, 2026, below all major daily moving averages in a confirmed bearish structure.
- The Fear & Greed Index sits at 12 — Extreme Fear, historically a level that precedes either capitulation or a prolonged base-building phase.
- Daily RSI at 38.5 is not yet oversold, meaning no technical floor is forcing a bounce, though bearish momentum shows early signs of weakening.
- The immediate battleground is defined by $1,628 support and $1,695 resistance; a breakout from this range will likely set the next directional leg.
- Bitcoin dominance above 56% confirms capital is not rotating into altcoins, keeping ETH under sustained macro pressure.
The Daily Chart Tells the Honest Story
The daily chart confirms a textbook bearish cascade, with ETH trading below every major moving average and offering no structural evidence of a trend reversal. Price at $1,658 sits below the 20-day EMA at $1,733, the 50-day EMA at $1,881, and the 200-day EMA at $2,390. That stacking — price below all three, with each EMA below the next — is a classic bearish cascade. The trend is down, and the burden of proof rests entirely on the bulls.
The daily RSI at 38.5 offers two simultaneous readings. It is not yet oversold, so no technical floor forces a bounce, yet it is low enough that chasing shorts carries mean-reversion risk. Meanwhile, the MACD histogram prints +9.32, with the MACD line at -67.27 curling toward the signal line at -76.59. That represents weakening bearish momentum — not a reversal signal, but worth monitoring.
Bollinger Bands frame the range with the midline at $1,692, the upper band at $1,802, and the lower band at $1,582. ETH trades in the bearish half, between the midline and lower band. The ATR of 73.9 points reflects meaningful daily volatility — this is not a low-volatility consolidation. Moreover, daily pivot levels place support at S1: $1,628 and resistance at R1: $1,674, which has so far acted as a ceiling. A clean close above R1 would be the minimum requirement for any intraday recovery.
The Hourly: A Market in Transition, Not Confirmation
The hourly chart reveals a genuine intraday recovery in progress, though it remains constrained within a broader bearish macro structure. Price at $1,658.62 now sits above the 1H 20 EMA at $1,633 and the 50 EMA at $1,652 — a meaningful short-term shift. The 1H RSI at 59.33 holds comfortably above the midpoint, and the MACD histogram has flipped positive to +7.56, with the MACD line rising through the signal.
However, the 1H 200 EMA at $1,695 represents the ceiling this bounce must crack to carry structural weight. Until ETH closes above that level, the recovery plays out inside still-bearish macro conditions. The 1H Bollinger upper band at $1,677 also acts as near-term resistance. The regime classification remains neutral — a tug-of-war, not a trend.
The 15-Minute: Overbought in a Downtrend
The 15-minute timeframe signals overbought conditions at RSI 76.99, making near-term entries high-risk despite visible short-term momentum. RSI on the M15 sits at 76.99 — firmly in overbought territory. All three EMAs on this timeframe remain below price, and the MACD histogram stays positive. The short-term momentum is real, but buying into a 15-minute overbought condition within a daily downtrend carries elevated risk. The M15 pivot at $1,657.45 with R1 at $1,659.96 shows how compressed resistance levels are — very little room exists above before friction returns.
DeFi Activity: A Mixed Signal Worth Noting
On-chain data paints a fragmented picture of DeFi activity, with Uniswap V3 surging while other protocols post sharp declines. According to DefiLlama, Uniswap V3 recorded a remarkable +134% spike in daily fees, while Fluid DEX posted a solid +6.38% for the day. This suggests on-chain usage is not dead — traders are moving capital and hunting opportunities in the volatility. However, Uniswap V4 fees dropped nearly 15% and Ekubo collapsed almost 90%. The picture is fragmented: isolated pockets of activity within a broadly risk-averse market, not a broad DeFi resurgence.
The Scenarios That Actually Matter
Two scenarios define the near-term path forward: a bullish reclaim above $1,695 or a bearish breakdown below $1,628. The bullish case requires ETH to hold above the daily pivot at $1,644, push through R1 at $1,674 with conviction, and then attack the 1H 200 EMA at $1,695. If that cluster gives way and price reclaims the daily 20 EMA at $1,733, the narrative shifts from relief bounce to potential base. What invalidates this scenario is straightforward: a daily close below S1 at $1,628 puts the lower Bollinger Band at $1,582 directly in play, and from there the conversation shifts to whether the $1,500 psychological level can hold.
The bearish case remains the higher-probability read. Price sits below every major daily average, the regime is bearish, sentiment registers Extreme Fear, and Bitcoin absorbs market share. If the current intraday bounce fades at the $1,674–$1,695 resistance cluster, this becomes another failed relief rally. That said, a sustained reclaim above $1,800 would invalidate the bear case by forcing a structural re-evaluation.
Reading the Room
The Ethereum price today is a story of conflicting timeframes, where the daily trend says one thing and the hourly chart says another — and that tension is the main event. The daily remains bearish, the hourly is recovering, and the 15-minute is already stretched. That configuration does not favor loading up in either direction — it favors waiting for resolution.
With the ATR near $74 on the daily, any directional move can materialize quickly. Sentiment at Extreme Fear means emotional reactions — both upward and downward — are likely amplified. The key numbers remain $1,628 on the downside and $1,695 on the upside. Those two levels define the immediate battlefield. A breakout confirmed on the daily will set the tone for the next meaningful leg. Until then, this market rewards patience far more than conviction.
FAQ
Is Ethereum’s current price a buying opportunity?
With the daily RSI at 38.5 and sentiment at Extreme Fear, ETH is approaching levels where historical bottoms have formed. However, the absence of any confirmed support structure means the risk of further downside remains elevated. Waiting for a daily close above the 20-day EMA at $1,733 would provide a more reliable entry signal than buying into current uncertainty.
What is the most important resistance level for Ethereum right now?
The $1,695 level — corresponding to the 1H 200 EMA — is the immediate ceiling bulls must overcome. Beyond that, the daily 20 EMA at $1,733 represents the first major structural resistance. A sustained move above $1,800 would be required to challenge the broader bearish regime.
Why isn’t Ethereum benefiting from DeFi activity?
While Uniswap V3 recorded a 134% spike in daily fees, other protocols like Uniswap V4 and Ekubo posted significant declines. The fragmented nature of this activity suggests tactical trading rather than a broad DeFi resurgence. Meanwhile, Bitcoin dominance above 56% confirms capital is concentrating in BTC rather than rotating into Ethereum.
Disclaimer: This article is for informational purposes only and does not constitute financial advice, an investment recommendation, or a solicitation to buy or sell any financial instrument or cryptocurrency. The analysis provided is not indicative of future results. Investing in crypto assets and financial markets carries a high risk of capital loss. Always do your own research (DYOR) and consult a qualified financial advisor before making any decision.
Article produced with the assistance of artificial intelligence and reviewed by the editorial team.


You May Also Like

Nutrient Absorption Emerges as Key Wellness Focus, ORGANA International Says

Johor Umno Youth files police report against Puad Zarkashi over alleged 3R remarks

Dr. Doom Roubini: Stablecoins Are Crypto’s Only Real-World Use Case


