

Hyperliquid (HYPE) Drops 22% From Peak: Should Investors Buy the Dip?
Quick Overview
- HYPE has retreated 22% from its peak of $76.9, now hovering around $66
- Critical support zone between $50 and $54 coincides with the 50-day EMA
- Trader engagement has declined with open interest falling from $2.2B to $1.73B
- Spot market pressure is declining, though spot CVD stays negative at -$95M
- Crypto analyst Altcoin Sherpa identifies $55–$64 as an attractive accumulation range targeting $100
The HYPE token from Hyperliquid has experienced a 22% decline from its all-time peak of $76.9 achieved in recent trading sessions. Currently changing hands near $66, market participants are evaluating whether the bullish momentum that began in January remains intact.
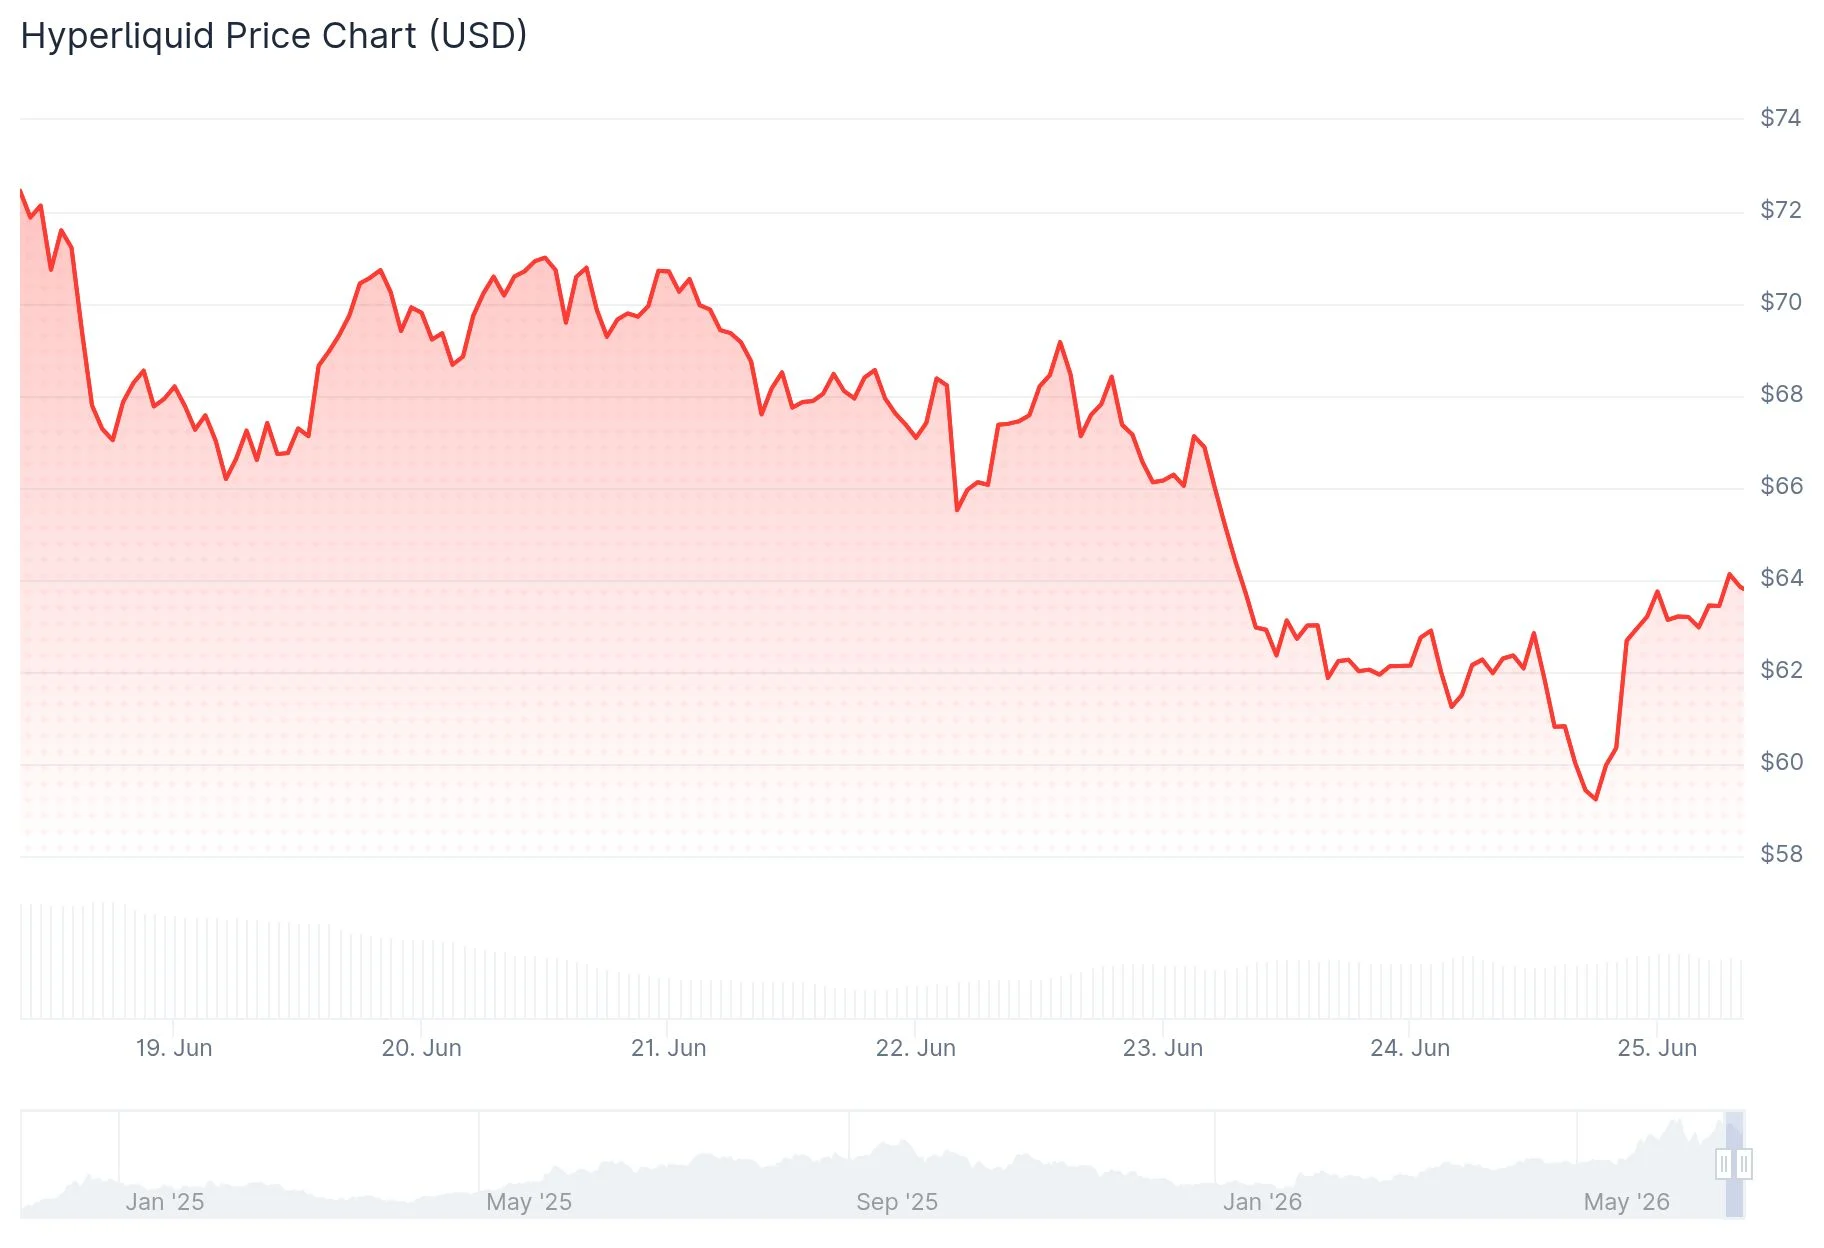 Hyperliquid (HYPE) Price
The correction emerged after the token failed to sustain levels above its record high near $76. During midweek trading, HYPE dipped beneath the $60 threshold before finding stability. The 50-day exponential moving average, which has provided consistent support during the March-initiated rally, is now facing a critical test.
Futures market metrics continue to reflect optimistic sentiment. Data from CoinGlass indicates a long-to-short ratio standing at 1.03, accompanied by positive funding rates of 0.0042%. This configuration shows long position holders are compensating short sellers, indicating prevailing expectations for upward price movement.
Spot Market Pressure Shows Signs of Relief
The intensity of spot selling has diminished compared to early June levels. The aggregated spot cumulative volume delta (CVD) has recovered from recent lows, although it maintains a substantially negative reading around -$95 million. When prices dropped from $76 in early June, spot selling pressure peaked at $110 million.
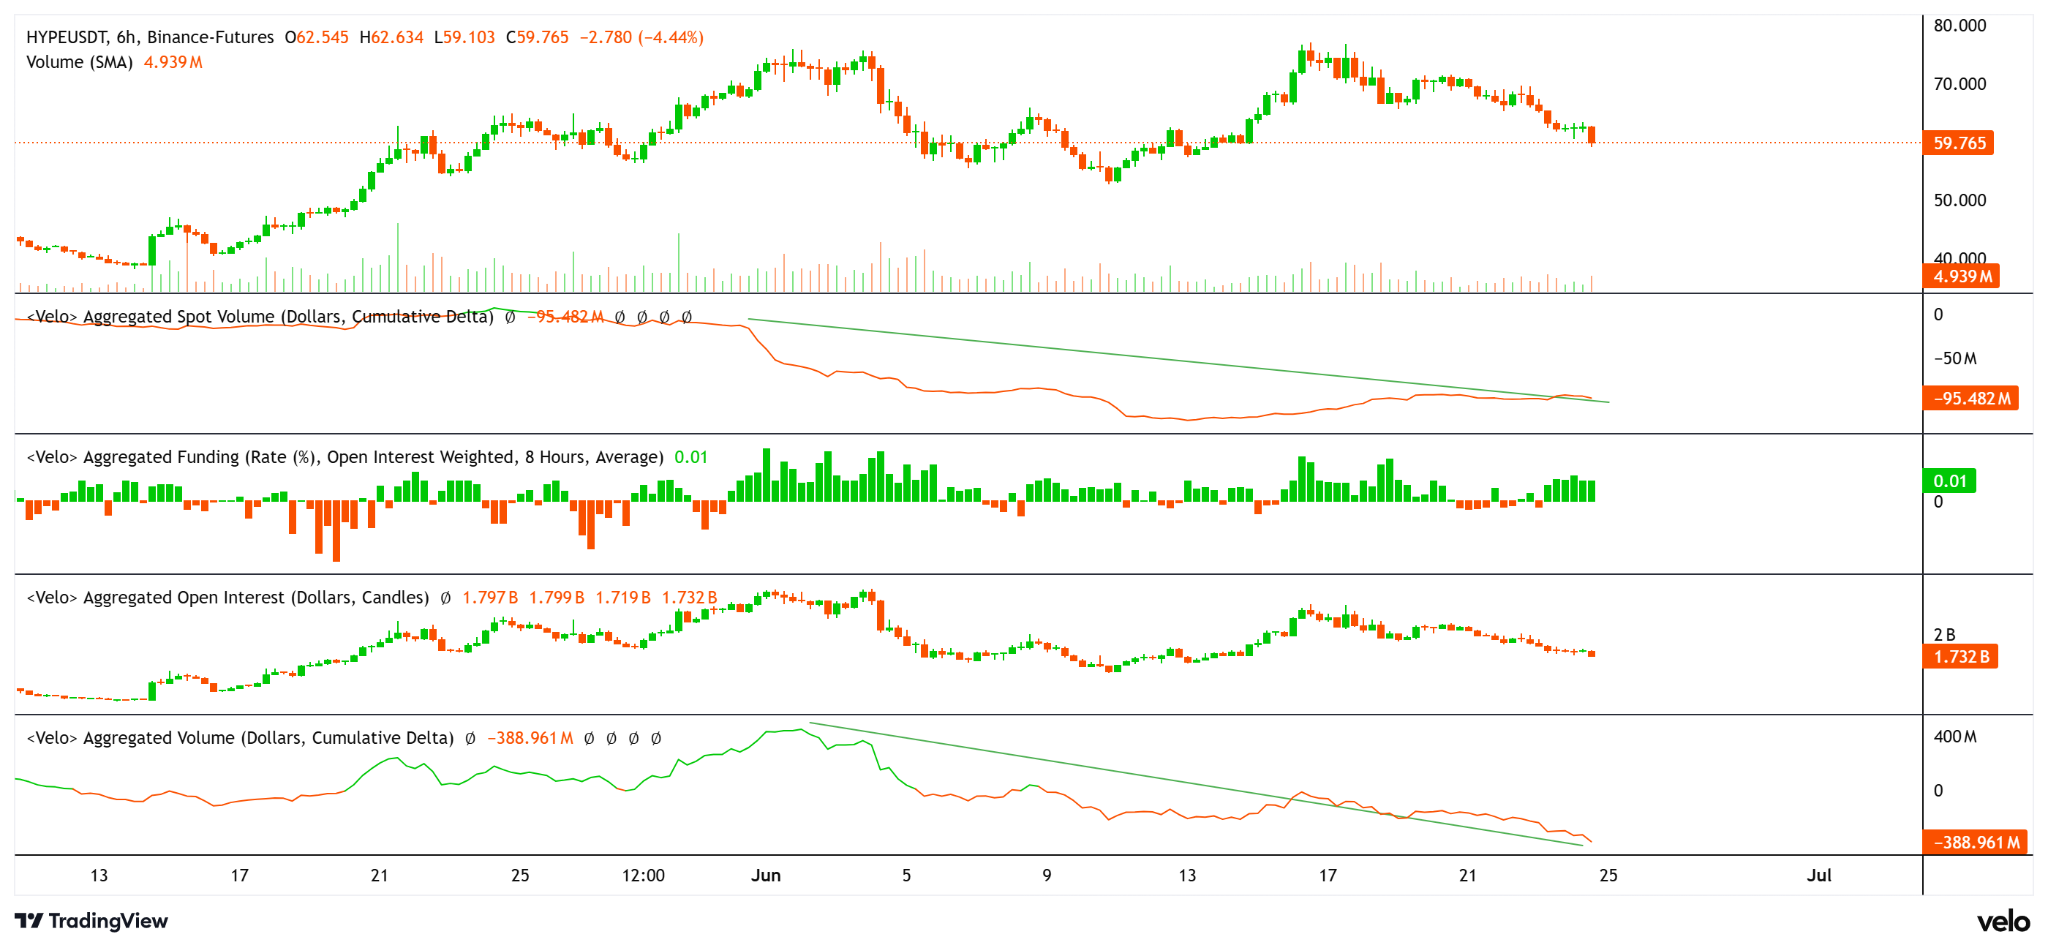 Source: Velo
The derivatives landscape tells a more reserved story. Open interest has contracted from $2.2 billion down to $1.73 billion. Derivatives CVD hovers near -$389 million. This suggests market participants are reducing their positions rather than establishing fresh trades.
Social dominance metrics for HYPE have been declining since June 17, currently registering at 0.175% per Santiment data. Increased retail engagement following the all-time highs has emerged, which certain market observers interpret as a potential caution signal for short-term price action.
Spot ETF activity has remained subdued throughout the week, with SoSoValue reporting minimal institutional involvement.
Critical $50–$54 Zone Emerges as Pivotal Support
The most significant support level appears between $50 and $54. This zone aligns with both the ascending 50-day EMA and an unfilled daily fair-value gap. A daily candle closing beneath $53 would mark the first bearish structural shift on the daily timeframe for this year.
Beneath this level, the 100-day EMA positioned at $51.57 represents the subsequent support, with $49 following. More substantial support exists around the $38 level.
Cryptocurrency analyst Altcoin Sherpa provided his perspective on the current market structure: “HYPE, I think anywhere in the 55–64 area is a pretty good place to accumulate this one. I think it goes to $100 later this year personally and is still the best altcoin…but it’s going to also depend a lot on bitcoin IMO.”
For bullish continuation, a daily close exceeding $74.60 would clear the pathway toward establishing fresh highs. The 50-day EMA currently resides at $58.94, the 100-day at $51.57, and the 200-day at $44.68, all positioned below current price action and indicating the broader uptrend structure remains unbroken.
The Relative Strength Index reads approximately 53 on the daily timeframe, while the MACD displays marginally negative values, indicating momentum has moderated without transitioning to bearish territory.
The post Hyperliquid (HYPE) Drops 22% From Peak: Should Investors Buy the Dip? appeared first on Blockonomi.


You May Also Like

WhatsApp is not charging users a mandatory fee, but there’s a new subscription to know about

TIAA’s CEO made $26,000 in her first job but still maxed out her 401(k). She has advice for Gen Z
Apple (AAPL) Shares Tumble 5% Following Unexpected Price Increases on Mac and iPad Products


