

Alphabet Stock Drops 6% as Dow Inclusion and $10B Berkshire Bet Fail to Stop Sellers

Alphabet Stock faces mounting technical pressure. GOOGL closed at $345.29 on June 24, well below key moving averages and near its daily lower Bollinger Band. Sellers remain in control ahead of the Dow Jones Industrial Average inclusion on June 29.
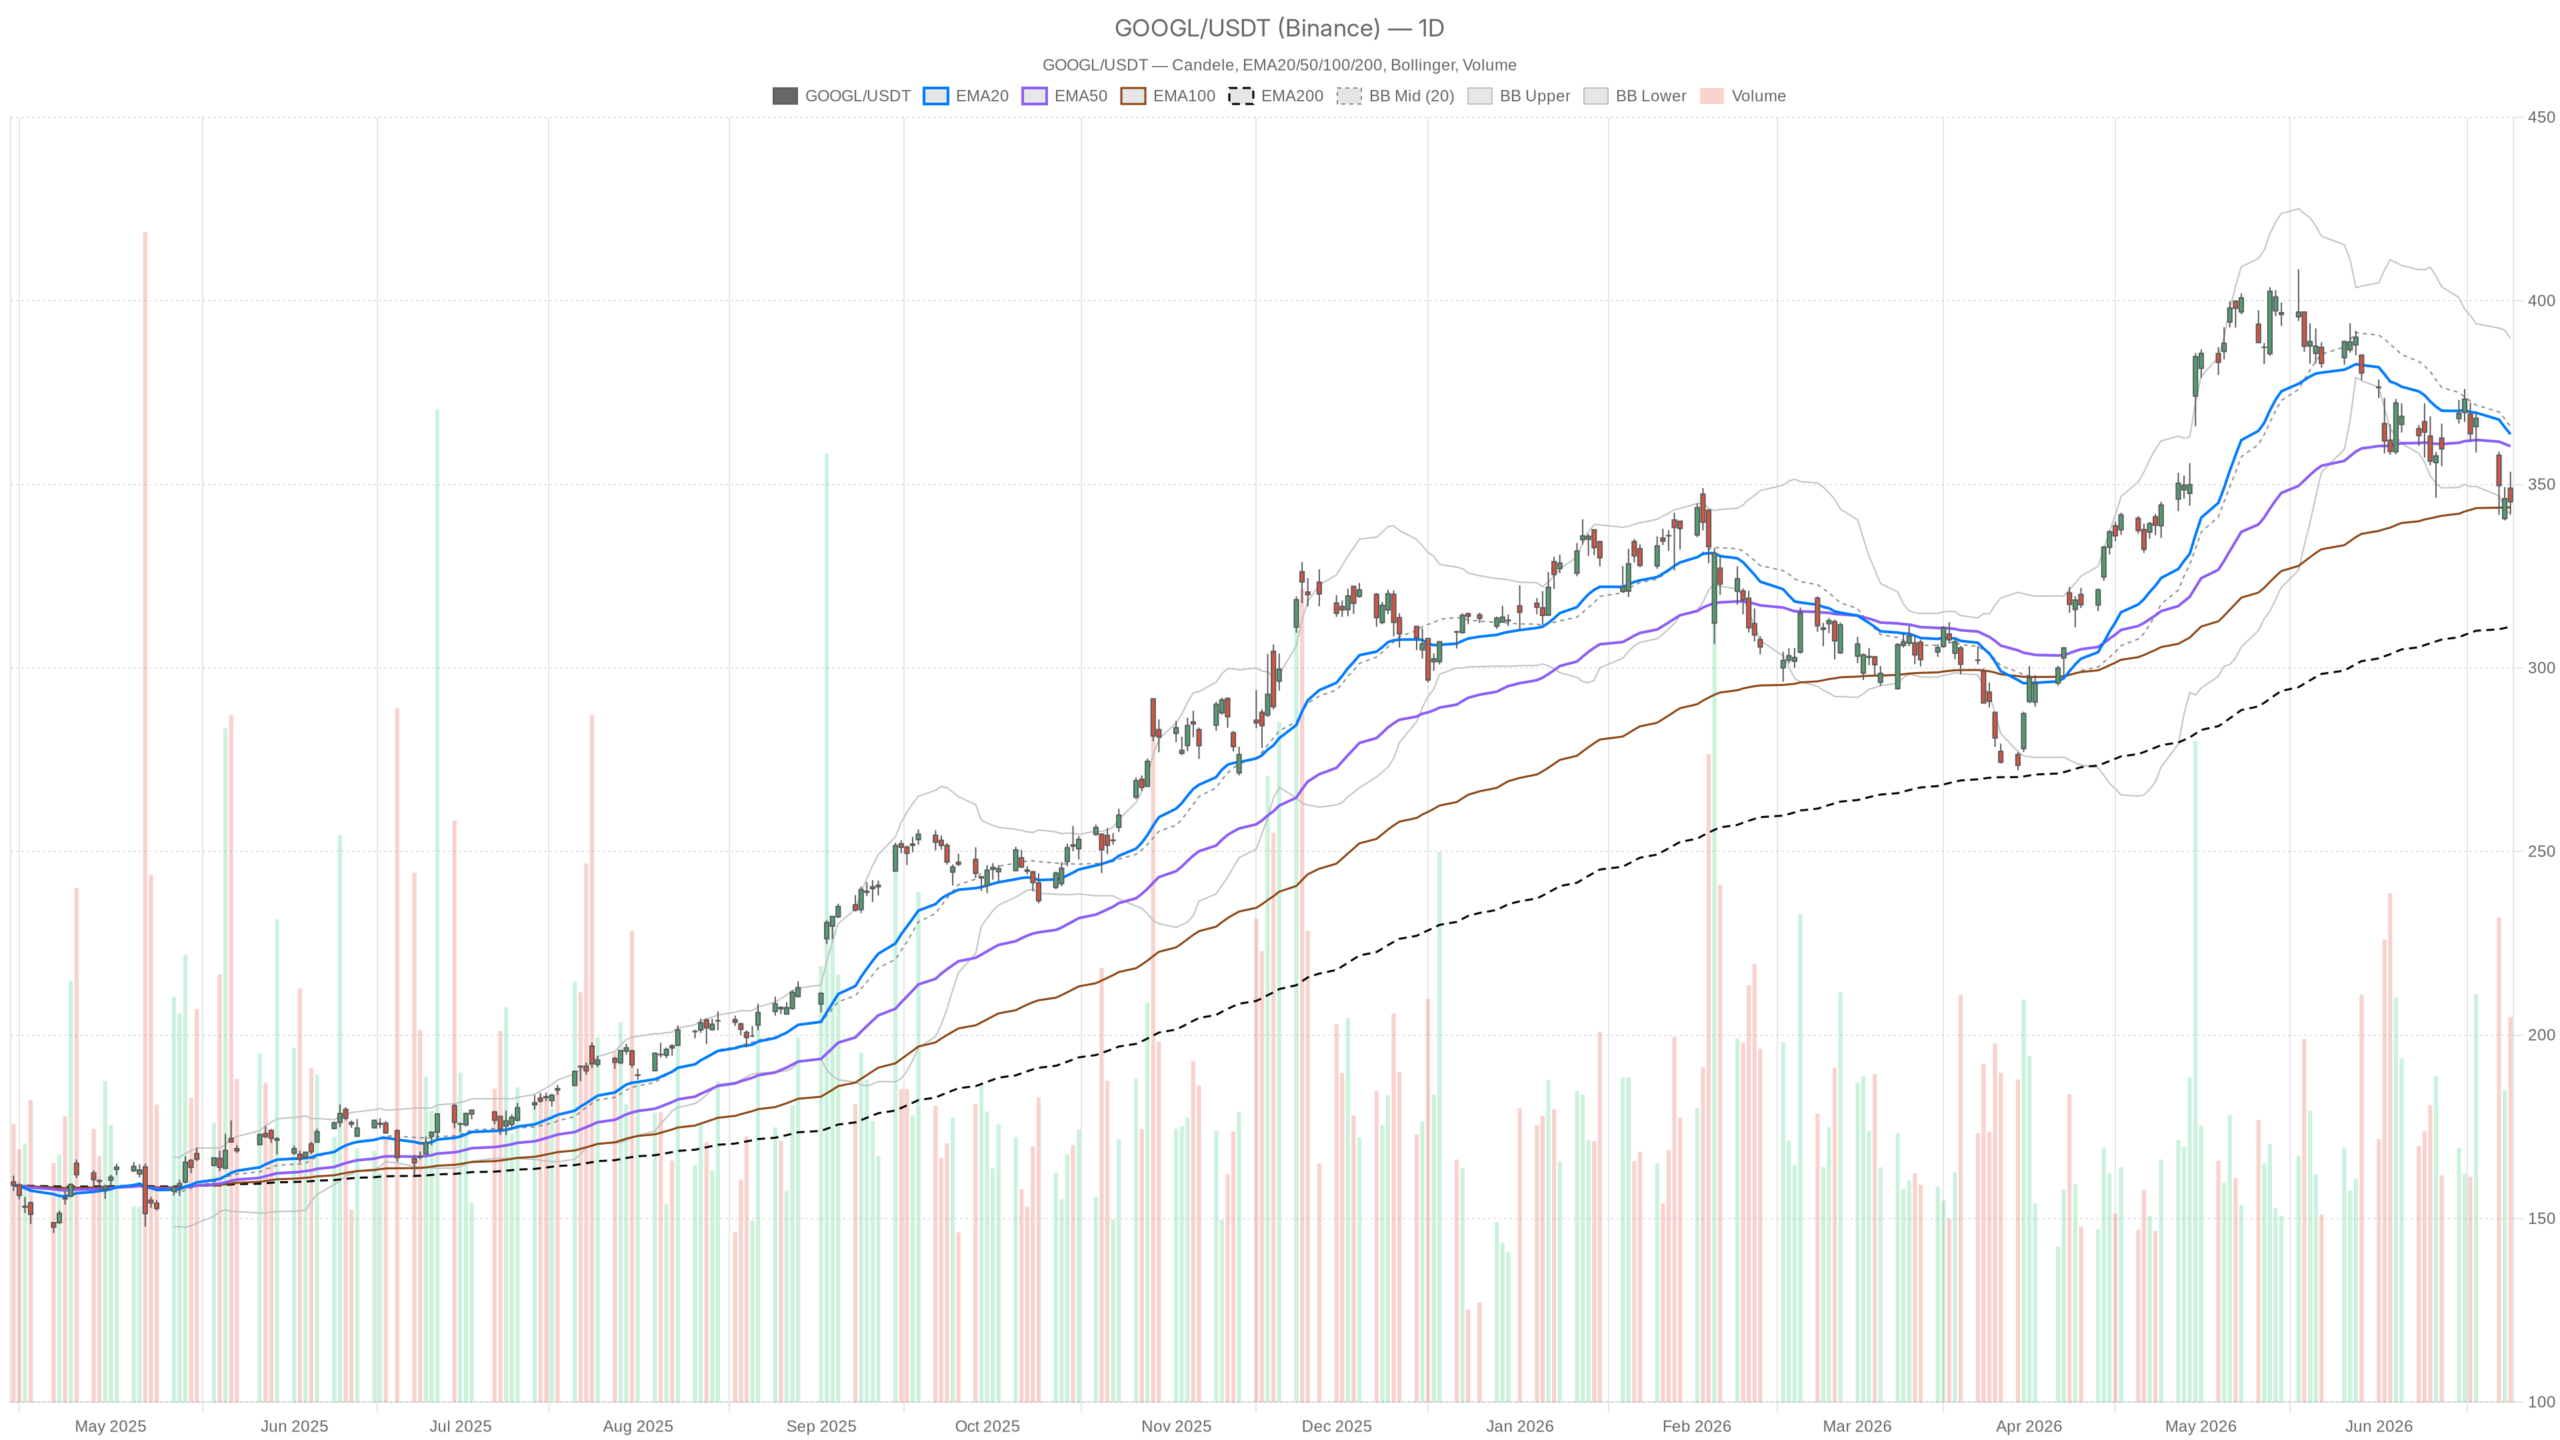 GOOGL — daily chart with candlesticks, EMA20/EMA50 and volume.
Key takeaways
- GOOGL closed at $345.29, below both its 20-day EMA ($363.66) and 50-day EMA ($360.42)
- Daily RSI sits at 36.98 — approaching oversold but not yet signaling a reversal
- The stock is walking the daily lower Bollinger Band at $341.63, indicating persistent selling pressure
- A break below S1 at $340.32 would expose a wide gap down to the 200-day EMA at $311.23
- Dow Jones inclusion on June 29 and Berkshire Hathaway’s investment offer potential catalysts, but neither has halted the selloff
Daily chart signals remain bearish for Alphabet Stock
GOOGL’s daily chart shows sellers firmly in control. The stock trades below both its 20-day EMA at $363.66 and 50-day EMA at $360.42. Both levels now act as overhead resistance. The medium-term trend is clearly deteriorating, even though the 200-day EMA at $311.23 provides a distant structural floor.
Meanwhile, the daily RSI sits at 36.98, approaching oversold territory but not yet at an extreme that would signal a convincing reversal. The MACD reinforces the bearish view. The MACD line at -5.40 sits below the signal line at -2.56, with a negative histogram of -2.84. The spread is still widening, suggesting no imminent cross.
Bollinger Bands and pivot levels in focus
Bollinger Band positioning adds further context. The daily mid-band sits at $365.71, far above the current close. However, the lower band at $341.63 is just below Tuesday’s intraday low of $341.93. GOOGL is essentially walking the lower band — a pattern that signals persistent selling rather than a clean bounce setup.
The daily ATR of $12.50 confirms meaningful volatility. Therefore, any significant move deserves attention. Pivot analysis places the pivot point at $346.90. GOOGL closed just below that level. The nearest support, S1, sits at $340.32, while resistance at R1 is $351.87. The stock remains sandwiched between these levels without strong conviction from either camp.
Intraday structure offers no relief for GOOGL
The hourly chart reinforces the bearish outlook. Price trades below all three key moving averages: the 1H EMA20 at $349.68, EMA50 at $355.52, and EMA200 at $366.21. All three slope downward, creating layered resistance that would require sustained buying to break through.
The 1H RSI at 37.32 mirrors the daily reading, confirming oversold-adjacent conditions without triggering a reversal. Still, the hourly MACD shows a faint improvement. The histogram has turned slightly positive at 0.31, with the MACD line at -3.45 beginning to converge toward the signal at -3.76. However, this is far too preliminary to interpret as a meaningful recovery catalyst.
On the 15-minute chart — used strictly for execution context — the regime remains bearish. The MACD histogram is -0.44 and RSI sits at 41.19, slightly higher than daily and hourly readings but still below 50. Price trades below its EMA20, EMA50, and EMA200. Meanwhile, the 15m ATR of 1.83 suggests moderate tick-level volatility, consistent with a stock drifting under pressure.
Fundamental landscape adds uncertainty
The upcoming Dow Jones Industrial Average inclusion on June 29, replacing Verizon, marks a notable institutional milestone. In theory, index inclusion should trigger forced buying from Dow-tracking funds. In contrast, Alphabet Stock dropped roughly 6% ahead of that event — a reaction that raises questions rather than providing comfort.
Notably, Berkshire Hathaway’s reported $10 billion private placement investment signals high-conviction institutional interest in Alphabet’s AI trajectory. At the same time, Citizens analysts flagged renewed concerns about AI talent retention — a risk that has surfaced repeatedly across the sector. In an AI race where engineering talent is the core asset, that flag matters.
Bullish scenario: can Alphabet Stock stage a recovery?
A bullish reversal for Alphabet Stock requires the daily lower Bollinger Band at $341.63 to hold as a hard floor. If the stock reclaims the daily pivot at $346.90 and pushes through R1 at $351.87, that would signal a meaningful shift in short-term structure.
On the hourly chart, a confirmed break above the EMA20 at $349.68 would mark the first credible signal. Expanding volume would confirm buyers are stepping back in. The Dow inclusion event on June 29 could serve as a catalyst if institutional index-tracking demand generates sufficient buying pressure. The Berkshire investment narrative may also help anchor sentiment among longer-term holders.
Bearish scenario: what happens if support fails?
On the other hand, a break below daily S1 at $340.32 would represent a technical breakdown for Alphabet Stock. A move below the lower Bollinger Band at $341.63 would confirm it. In that case, the next identifiable support is considerably lower, given the wide gap to the 200-day EMA at $311.23.
The MACD continues to widen on the daily frame. If the hourly MACD histogram’s tentative improvement reverses before price can reclaim key levels, the path of least resistance remains downward. Continued AI talent attrition concerns could also give institutional sellers a reason to stay active.
Overall, Alphabet Stock navigates a challenging confluence of technical deterioration and news-driven uncertainty. The price sits near critical support with oversold momentum but no confirmed reversal. The Dow inclusion is days away, offering a potential short-term floor — but the technical structure demands caution. Positioning here carries risk in both directions, with daily volatility of roughly $12.50 suggesting any resolution will be sharp.
FAQ
What are the key support levels for Alphabet Stock right now?
The immediate support is the daily lower Bollinger Band at $341.63, followed by daily S1 at $340.32. A break below these levels would expose a wide gap to the next structural support at the 200-day EMA of $311.23.
Could the Dow Jones inclusion on June 29 reverse the selloff?
The Dow inclusion could act as a short-term catalyst by triggering forced buying from index-tracking funds. However, Alphabet Stock has already dropped roughly 6% ahead of the event, suggesting the market may have priced in any index-driven demand or that broader concerns are outweighing the technical catalyst.
Is the MACD signaling an imminent reversal?
Not on the daily timeframe. The daily MACD line at -5.40 remains below the signal line at -2.56, with the histogram still widening at -2.84. The hourly MACD shows a very early tentative improvement, but it is too preliminary to be considered a reliable reversal signal.
What does the RSI indicate about GOOGL’s current positioning?
The daily RSI at 36.98 is approaching oversold territory but has not reached an extreme that would typically signal a convincing reversal. The hourly RSI at 37.32 mirrors this reading, confirming oversold-adjacent conditions without triggering a buy signal.
Disclaimer: This article is for informational purposes only and does not constitute financial advice, an investment recommendation, or a solicitation to buy or sell any financial instrument or cryptocurrency. The analysis provided is not indicative of future results. Investing in crypto assets and financial markets carries a high risk of capital loss. Always do your own research (DYOR) and consult a qualified financial advisor before making any decision.
Article produced with the assistance of artificial intelligence and reviewed by the editorial team.


You May Also Like

Alabama Enacts Dual Legislative Breakthrough in Blockchain and Judicial Reform
Digital Currency X Technology Enters Into Securities Purchase Agreement for a Private Placement of US$700 Million of Units, Payable in U.S. Dollars or Digital Assets, to Advance Its Digital Asset Treasury Strategy

Jeers rain down on Sean Duffy over Great American Fair remarks: 'You're garbage'


