

XRP Price Just Confirmed What Bulls Were Waiting For!
XRP price dipped another 5% today, along with the broader crypto market crashing. The token is now trading exactly at $1.00 at press time. Bitcoin price broke below $60,000, dragging everything down with it.
Over $600 million in liquidations hit the market in just one hour. XRP longs accounted for over $40 million of that total. The selling pressure has been relentless.
But one crypto and financial markets veteran sees this as exactly the move he has been waiting for.
Celal Kucuker: The XRP Price Bottom Is $0.86–$0.87, the Target Is $8–$9
Celal Kucuker, a financial analyst with over 20 years of market experience, tweeted his latest XRP price outlook:
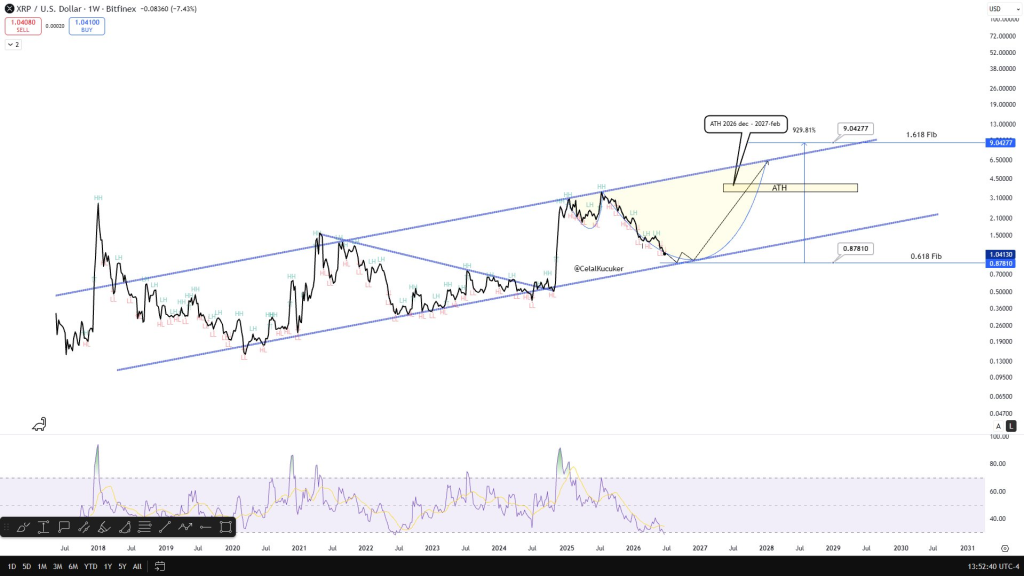
“I’ve shared this chart before. I still think it’s one of the best scenarios for XRP. In my view, the bottom is around $0.86–$0.87, while the top target is about 10x higher, in the $8–$9 range. This chart aligns well with the $54K Bitcoin scenario.”
Kucuker has been tracking XRP’s multi-year ascending channel for months. In a previous post on June 6, 2026, he outlined what he called “the most realistic scenario” for XRP’s price. According to Kucuker, XRP could climb to the $10 level between December 2026 and February 2027.
The chart is based on XRP’s monthly timeframe. It presents a recurring pattern of advances and corrections within an upward-sloping channel. Previous XRP rallies are shown reaching the upper boundary of the structure before entering periods of consolidation.
The key technical elements:
- Support near $0.878 – This aligns with Kucuker’s $0.86–$0.87 bottom range
- Fibonacci 1.618 extension at $9.04 – This is the primary target, matching his $8–$9 range
- Projected rally timeline – December 2026 to February 2027
Kucuker’s chart also aligns with the $54,000 Bitcoin scenario. If Bitcoin continues its current bear market trajectory toward that level, XRP could bottom at $0.86–$0.87 – exactly where he expects.
The XRP Chart: A Decade of Structure
The weekly chart Kucuker shared shows XRP’s price action from 2018 through 2031. The current price sits at $1.041, with key levels marked:
The 0.618 Fibonacci at $0.878 – This is the major support zone that Kucuker believes XRP will test. The price is currently above it, but the current downtrend suggests a move toward this level is likely.
The 1.618 Fibonacci at $9.042 – This is the primary upside target. Kucuker’s $8–$9 range is derived from this extension level. A move from $0.87 to $9.04 represents a 929% rally.
 Source: X/@CelalKucuker
The projected timeline – The chart shows a projected rally from the current support zone toward the $8–$9 target between December 2026 and February 2027. This aligns with the broader market expectation that the bear market will bottom in late 2026 before a recovery begins.
The trend channel – XRP has been trading within a long-term ascending channel since 2018. The current correction is testing the lower boundary of that channel. Historically, each test of the channel’s lower boundary has been followed by a significant rally.
Big News: Ripple Receives MiCA Preliminary Approval
While the price action is painful, Ripple just scored a major regulatory win.
Ripple Markets APAC Pte. Ltd. received preliminary approval under the EU’s Markets in Crypto-Assets (MiCA) regulation from Luxembourg’s CSSF. This milestone allows Ripple to offer regulated digital asset services, including payments and stablecoins, across the European Union.
What this means: This is bullish for XRP’s long-term utility because it provides a clear regulatory pathway for Ripple’s core payment and stablecoin products in a major market. The approval could drive institutional adoption and usage of the XRP Ledger.
Why it matters: The EU is one of the world’s largest and most sophisticated financial markets. MiCA provides a unified regulatory framework across 27 countries. Having Ripple’s services approved under this framework opens the door for banks, payment providers, and enterprises to use XRP and RLUSD with regulatory certainty.
This is the kind of fundamental news that builds long-term value, even if the XRP price is crashing today.
Read also: ChatGPT Predicts XRP Price if Binance Loses Access to the European Union Under MiCA
Where Could XRP Price Go From Here?
Kucuker’s analysis is one of the most bullish long-term scenarios for the XRP price. But there are different paths to that target.
Scenario 1: The Kucuker Base Case
XRP finds support near $0.86–$0.87, the 0.618 Fibonacci level. This aligns with the $54,000 Bitcoin bottom scenario. From that support, XRP begins a steady climb toward $1.50–$2.00 in late 2026. The real rally comes in 2027, pushing XRP toward $8–$9 as institutional adoption accelerates and the broader crypto market recovers.
Scenario 2: The Early Reversal
XRP does not reach $0.86–$0.87. Instead, it finds support closer to $0.93–$1.00, the current range. Buyers step in early, fueled by the MiCA approval news and ETF inflows. A rally toward $1.50–$1.80 follows. In this scenario, Kucuker’s $8–$9 target remains valid but the timeline is delayed.
Scenario 3: The Deeper Correction
XRP breaks below $0.86–$0.87. The 0.618 Fibonacci fails to hold. In a worst-case scenario, XRP could test the 0.786 level near $0.70 or even the 0.854 level near $0.62. This would align with a more severe Bitcoin crash, potentially toward $45,000–$50,000. In this case, the $8–$9 target would be pushed out to 2028 or later.
Our Take on XRP Price Action
Kucuker’s chart is credible and solid. The 0.618 Fibonacci support is a well-known technical level. The 1.618 extension target is mathematically derived. The multi-year ascending channel is intact.
The MiCA approval is a significant fundamental catalyst. It gives Ripple a clear regulatory pathway in one of the world’s largest financial markets. Over time, this should drive institutional adoption and usage of the XRP Ledger.
Short-term, the market is bleeding. Bitcoin is breaking below $60,000. Liquidations are massive. Fear is extreme. But Kucuker’s scenario aligns with the broader market pattern.
If Bitcoin bottoms around $54,000 in late 2026, XRP price could bottom near $0.87 (as we reported days ago) and then rally 10x from there. For that kind of rally, we’ll need a strong bull run to return.
Subscribe to our YouTube channel for daily crypto updates, market insights, and expert analysis.
The post XRP Price Just Confirmed What Bulls Were Waiting For! appeared first on CaptainAltcoin.


You May Also Like
XS.com review 2026: Security, regulation, and account types

Binance to Halt EU Services Next Week After MiCA License Setback
Euro Holds Above 1.1400 as Falling Oil and Weaker Dollar Provide Support


