Bitcoin Price Prediction as Spot ETF Outflows Jump to $1 Billion
Key Insights
- Bitcoin price dropped below the crucial support level of $80,000 this week.
- Spot Bitcoin ETFs shed over $2 billion in assets.
- Technical analysis points to more downside in the coming days.
Bitcoin slipped below the $80,000 level this week as institutional demand weakened and macroeconomic pressure returned across financial markets.
BTC fell to nearly $78,000 after failing multiple times to reclaim resistance near $82,800. The pullback followed heavy ETF outflows, rising Treasury yields, and renewed concerns around inflation and Federal Reserve policy.
Spot Bitcoin ETFs Suffered a $1 Billion Loss
Bitcoin ETFs, led by BlackRock’s IBIT, suffered substantial outflows this week as concerns about the US economy continued.
These funds had a $1 billion outflow this week, the worst performance since the last week of March this year. This outflow was a sharp reversal after the funds added assets in the previous six consecutive weeks
As a result, the funds have now had a net inflow of $252 million this month. This is a big disappointment as the funds added over $1.6 billion in the first few days of the month.
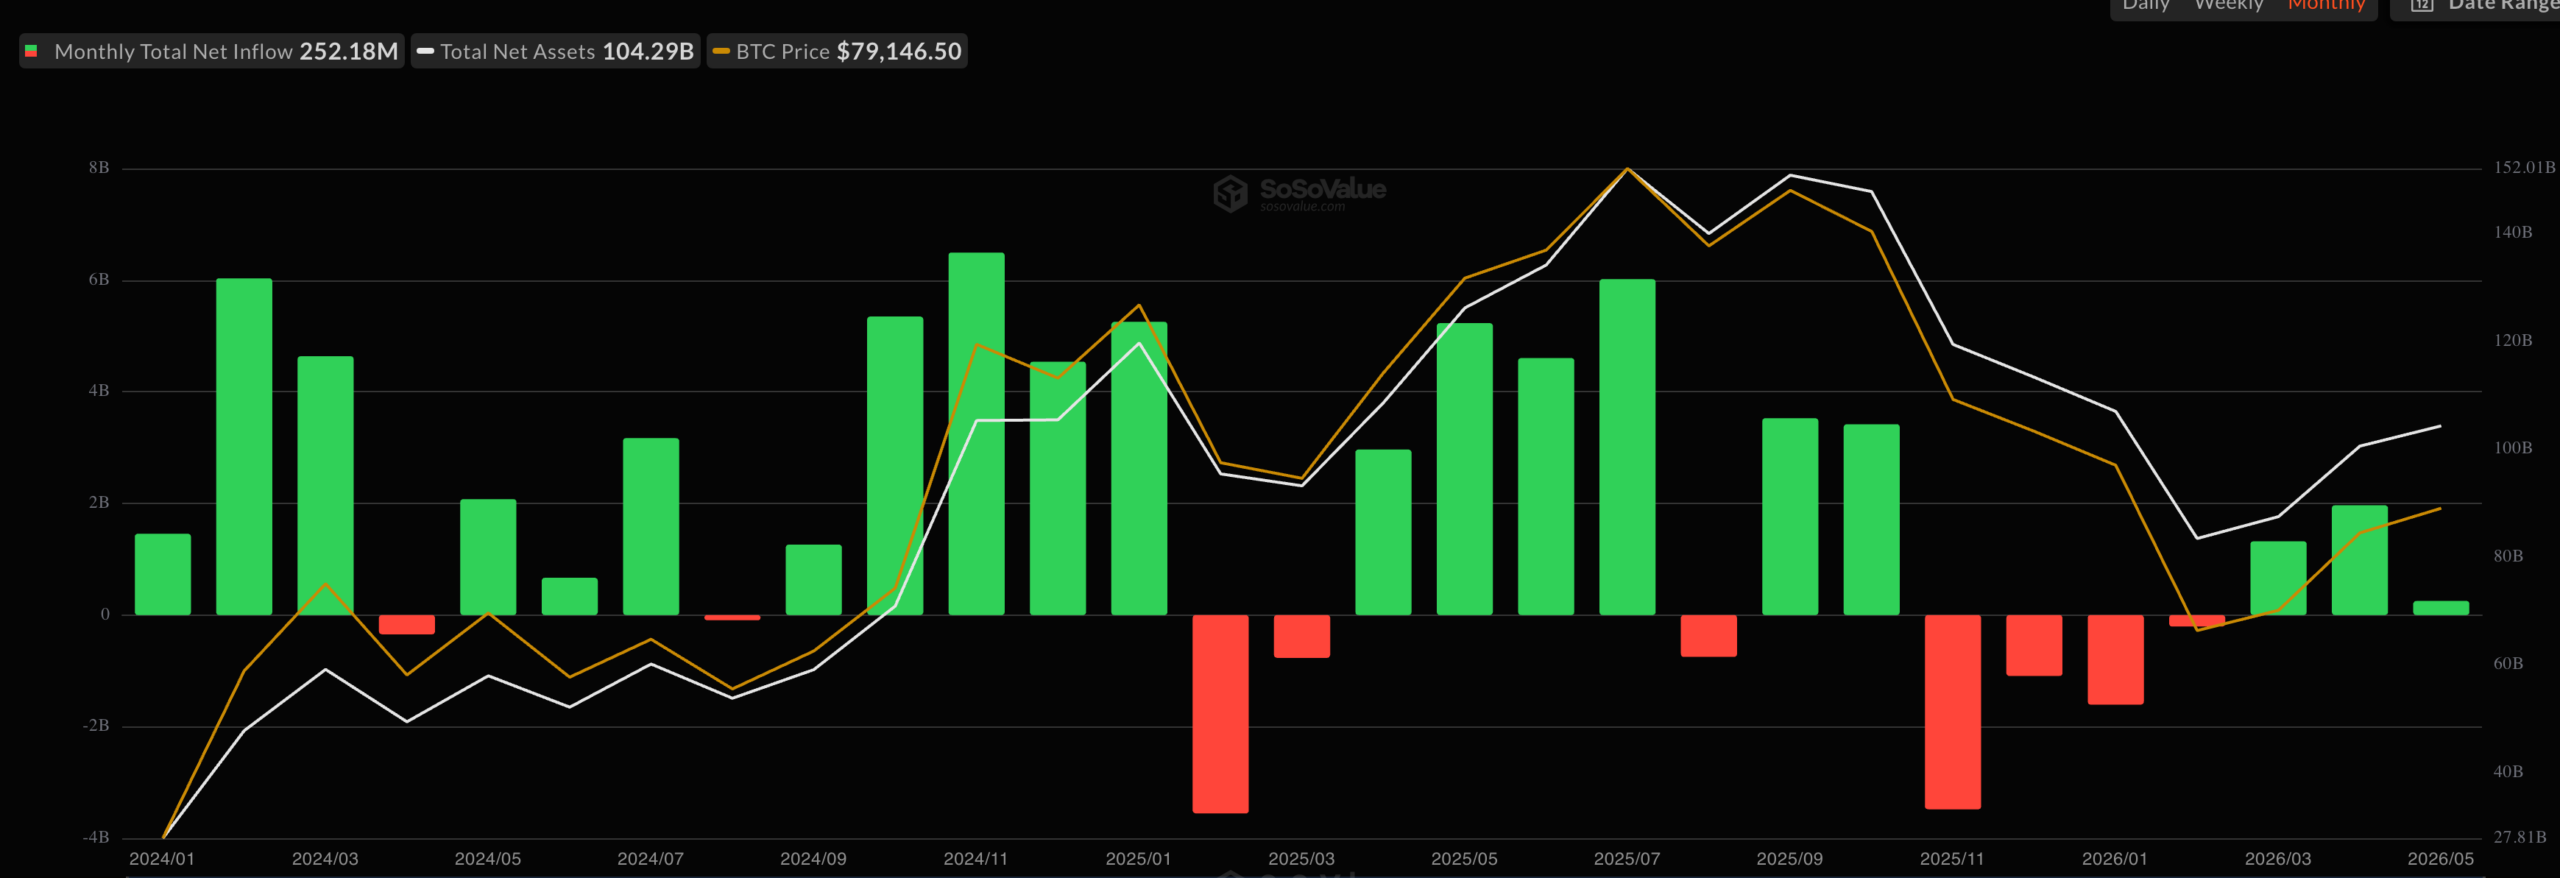 Spot BTC ETF | Source: SoSoValue
Data shows that BlackRock’s IBIT has the biggest market share in the Bitcoin ETF industry with over $64 billion in assets, and is followed by Fidelity’s FBTC, which has $14.7 billion.
The ongoing Bitcoin ETF outflows are a sign that some investors are booking profits after the coin jumped from the year-to-date low of $60,000 to $82,500 this month.
Also, another possible reason is that American investors are rotating from Bitcoin to the stock market, which is doing well. For example, top S&P 500 Index ETFs have added over $80 billion in assets this year, while the recently launched DRAM ETF has gained $10 billion.
Other crypto ETFs also suffered outflows this week. For example, the spot Ethereum ETFs lost assets in the last five consecutive days, bringing the monthly outflow to over $83 million.
Investors Embraced Risk-Off Sentiment After US Inflation Report
The ongoing Bitcoin price retreat is also happening because of the ongoing risk-off sentiment in the financial market.
For example, the US dollar index has jumped to $100, its highest level in months. Similarly, US bond yields have continued rising, with the government raising $25 billion in 30-year bonds at a 5% interest rate for the first time in over 30 years.
The stock market resumed its downtrend on Friday, with the benchmark Dow Jones, S&P 500, and Nasdaq 100 falling by over 1% on Friday. Popular stocks like Boeing, Nvidia, and Micron dropped by over 4% on Friday.
A major macro factor driving this price action is the rising inflation rate as the US-Iran quagmire continued. Two reports released this week sent shockwaves in the financial market, with the headline Consumer Price Index (CPI) and Producer Price Index (PPI) rising to 3.8% and 6%, respectively.
Therefore, the rising inflation rate is a sign that the Federal Reserve will find it hard to cut interest rates as President Donald Trump is advocating. Indeed, most traders on Polymarket don’t see a rate cut happening this year, which also explains why the bond yields are rising.
BTC Price Prediction as a Rising Wedge Pattern Forms
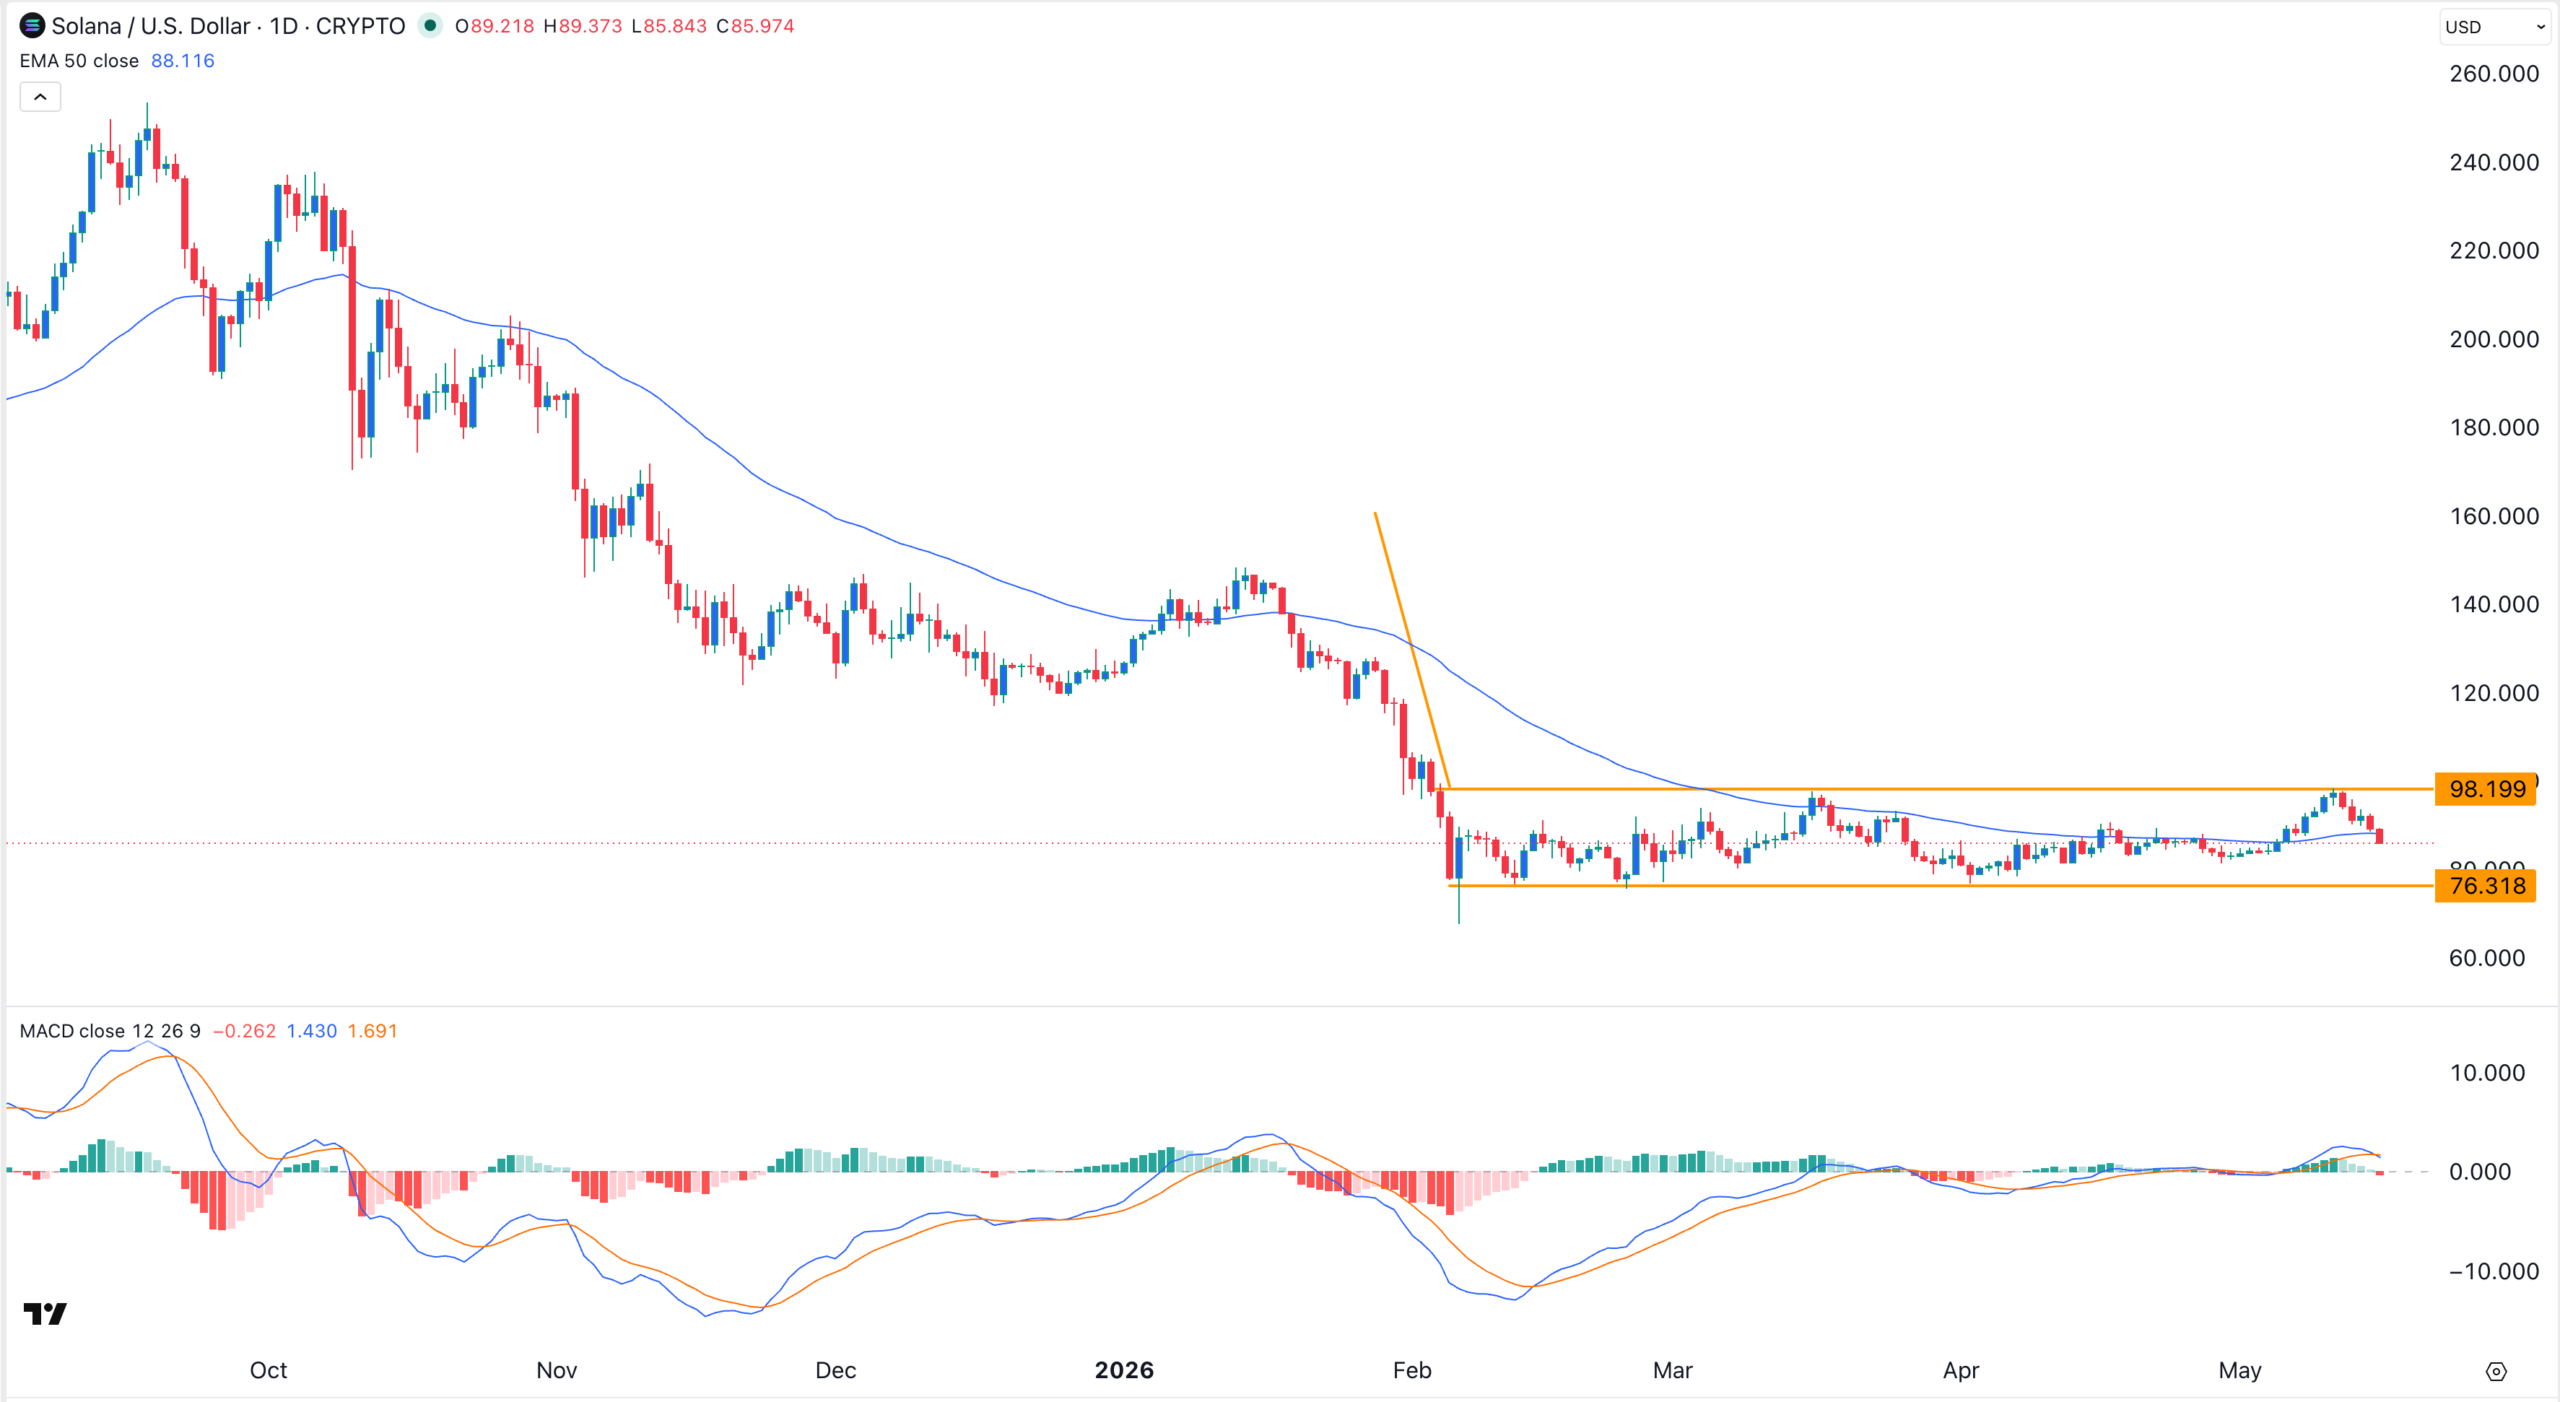
The daily chart points to more Bitcoin price downturn in the coming weeks for several reasons. First, the coin has struggled to move above the important resistance level of $82,847 this month, a sign of a bullish exhaustion.
Second, the two lines of the MACD indicator have formed a bearish crossover pattern and are pointing downwards. In most cases, this is a bearish divergence pattern, which often leads to a steeper sell-off.
Third, the coin has slowly formed a rising wedge pattern, which is characterized by two rising and converging trendlines. It has now moved below the lower side of this pattern, confirming its outlook.
 BTC price chart | Source: TradingView
Therefore, the coin will likely continue falling, a trend that will be confirmed when it moves below the 50-day Exponential Moving Average (EMA) at $76,850. If this happens, the coin will drop to the key support at $70,000.
The post Bitcoin Price Prediction as Spot ETF Outflows Jump to $1 Billion appeared first on The Market Periodical.


Ayrıca Şunları da Beğenebilirsiniz

MSTR Becomes Amplified Bitcoin; STRC Structures Volatility as Credit

Why Bitcoin Price Could Be Forming A Consolidation Structure Around $80,000