Rocket Lab Stock Rallies 16% on $8B Deal. The Chart Disagrees.

Rocket Lab stock surged 16% to $98.01 after announcing an $8 billion all-stock acquisition of Iridium Communications. The deal reframes RKLB as a vertically integrated space platform. However, daily technicals warn that key resistance at $101–$103 remains untested — and the broader regime stays neutral.
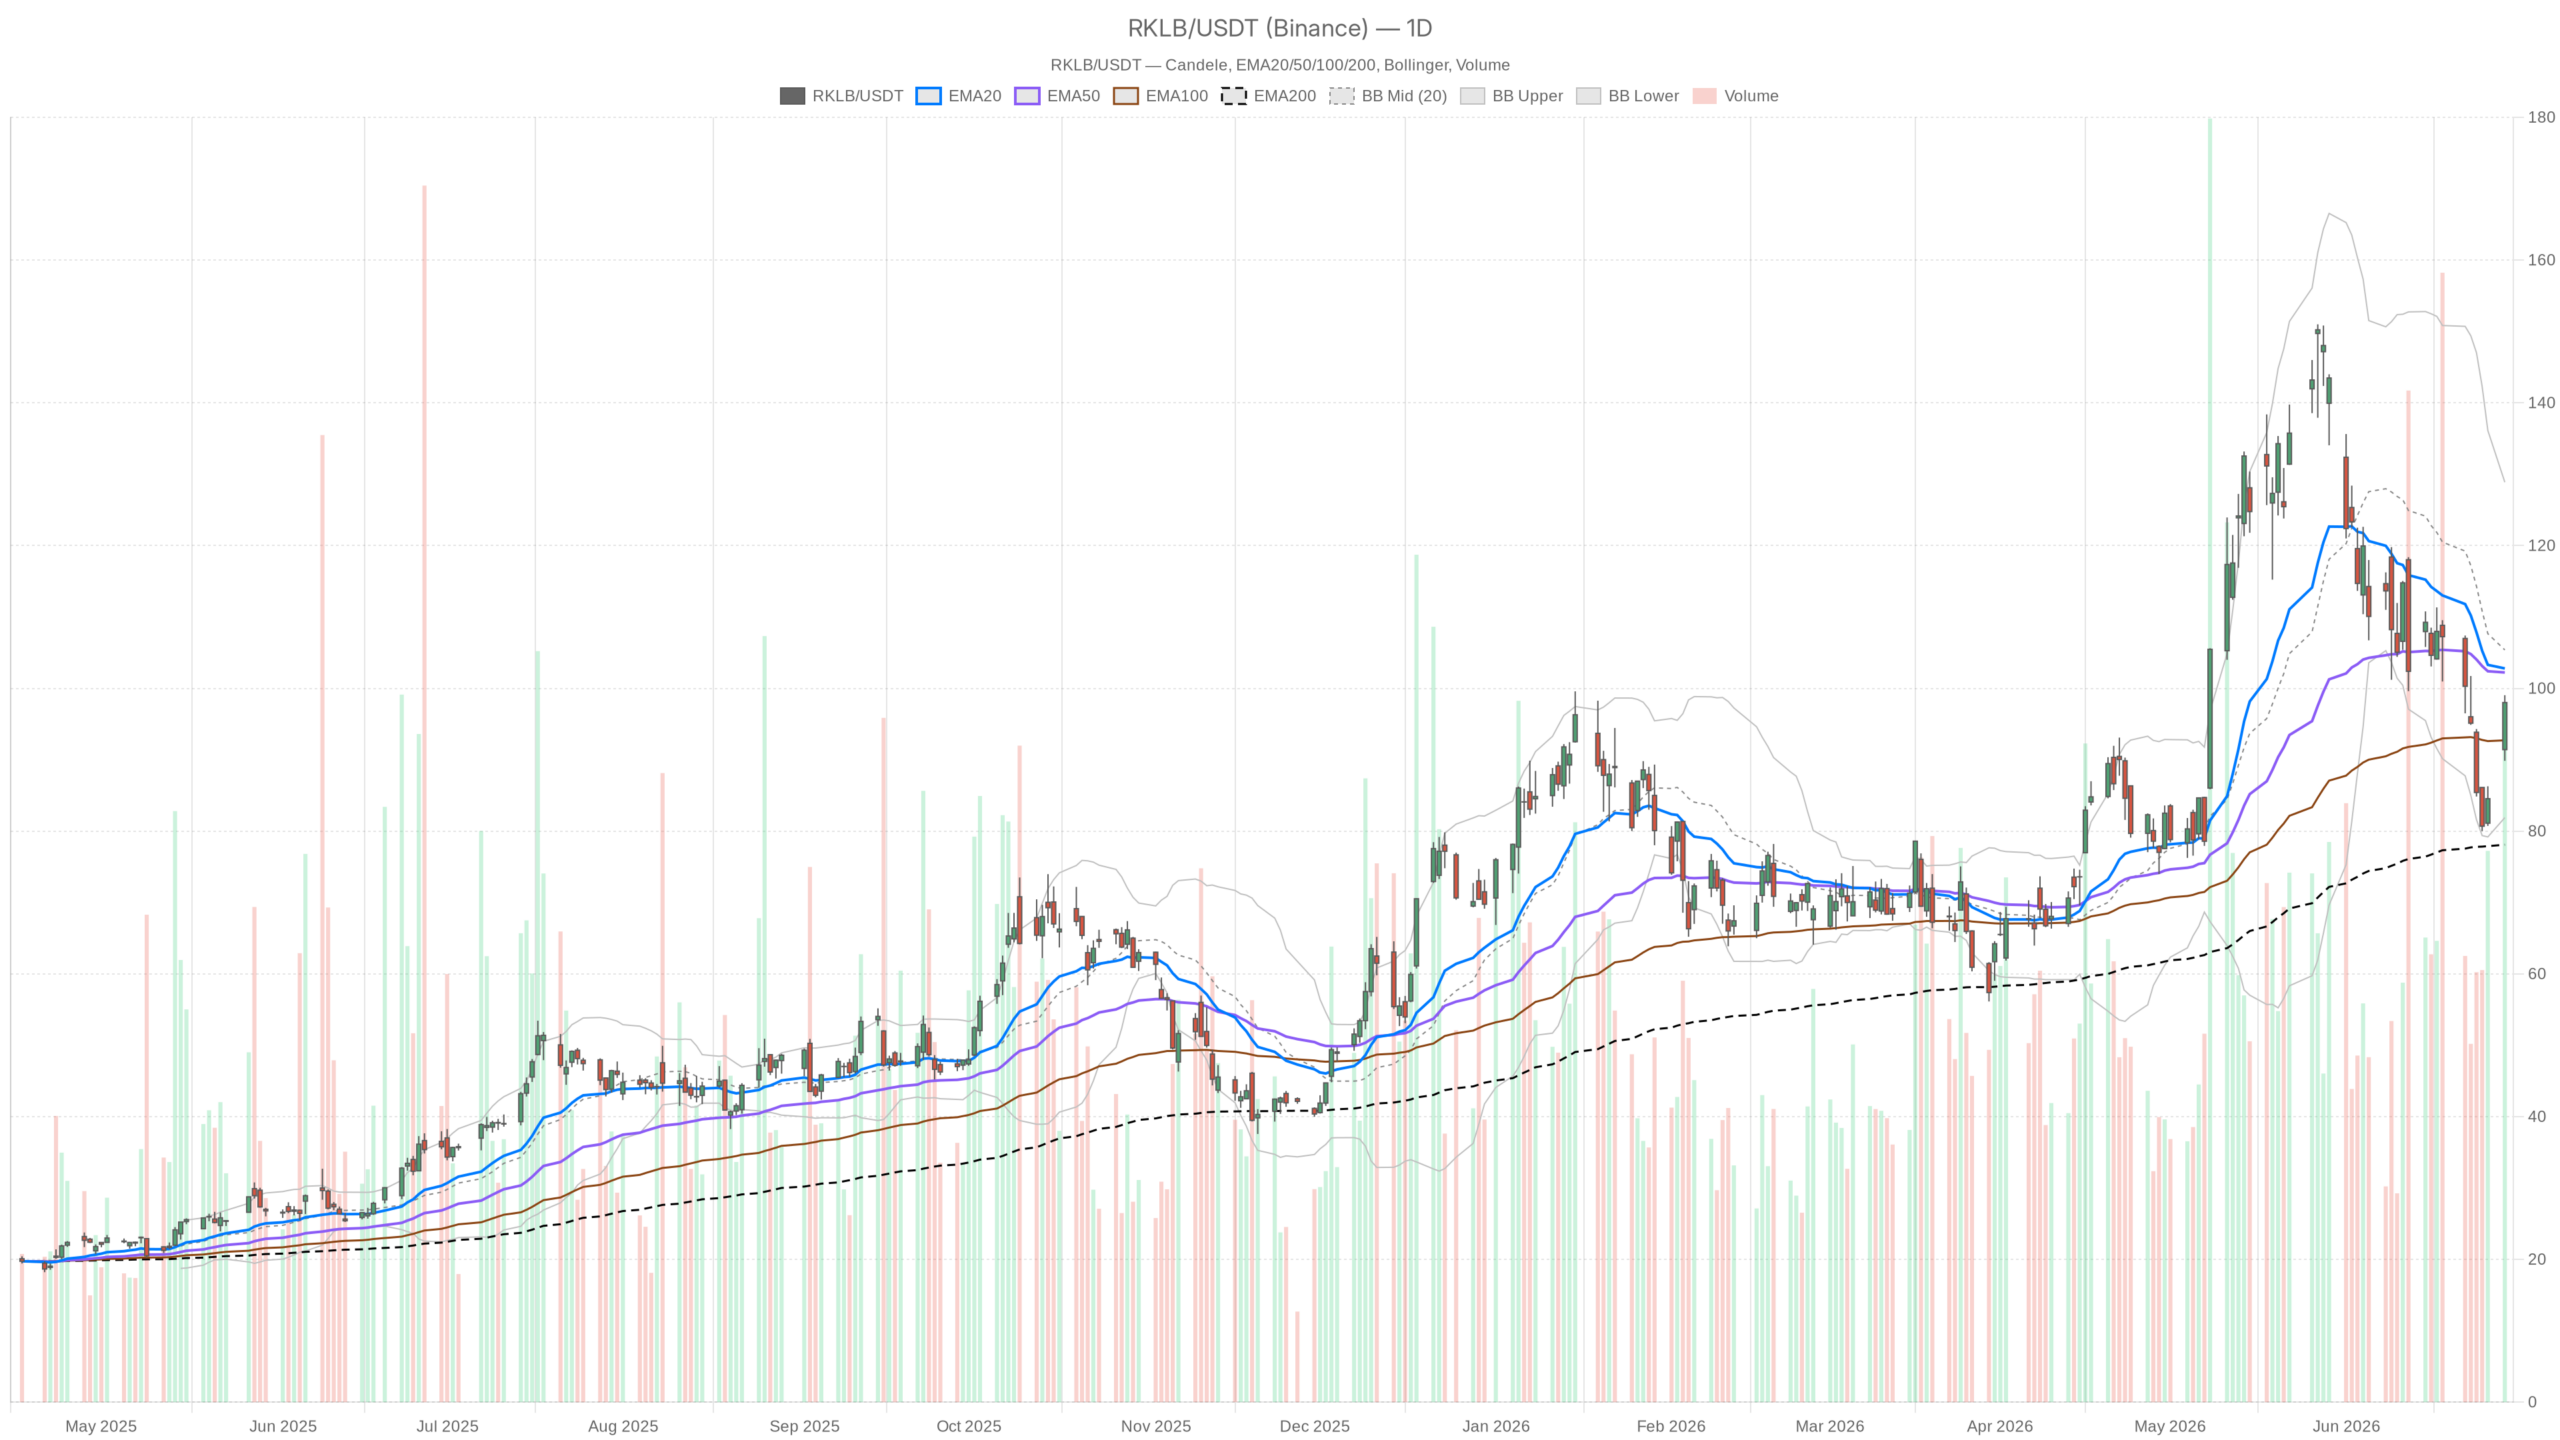 RKLB — daily chart with candlesticks, EMA20/EMA50 and volume.
Key takeaways
- Rocket Lab stock rallied 16% to $98.01 on the $8 billion Iridium deal, but remains below the 20-day EMA ($102.79) and 50-day EMA ($102.23).
- The daily MACD is still negative at -6.29, confirming the regime as neutral rather than bullish.
- The $101–$103 zone is the critical battleground — a daily close above would shift the structure toward bullish.
- Hourly momentum is constructive (RSI 67.44, positive MACD), supporting a near-term push toward resistance.
- Support sits at $92.23 (S1), with a deeper floor at the lower Bollinger Band ($81.89).
Rocket Lab Stock Daily Structure: A Bounce Within a Neutral Regime
Despite the 16% surge, Rocket Lab stock remains in a neutral daily regime. The price closed at $98.01, still below the converging 20-day EMA ($102.79) and 50-day EMA ($102.23). Those two averages form a near-term technical ceiling that the stock has yet to clear.
EMA Convergence Caps Rocket Lab Stock’s Upside
The 20-day EMA at $102.79 and the 50-day EMA at $102.23 are converging just above current price. This convergence creates a near-term technical ceiling. A decisive break above this cluster would mark a meaningful shift in the daily structure. Until then, the averages act as active resistance.
Negative MACD Keeps Rocket Lab Stock in Correction Mode
Meanwhile, the daily MACD sits at -6.29 against a signal of -3.42. The histogram reads -2.87. Momentum is recovering but remains firmly negative. This configuration reflects a stock bouncing hard inside a broader corrective phase. It is not yet in a confirmed uptrend.
Long-Term Anchors Provide a Structural Floor
Still, the longer-term picture offers one anchor of optimism. The 200-day EMA at $78.09 sits well below current price. Rocket Lab stock remains structurally elevated relative to its long-term trend baseline. The Bollinger Band midline is at $105.39. The lower band stands at $81.89, with the upper at $128.88. At $98.01, the stock trades between the midline and the lower band — still in the lower half of its recent range.
Volatility and RSI Confirm Cautious Positioning
The daily RSI at 46.31 reinforces this cautious read. It is not oversold but nowhere near overbought. Room exists for further upside, yet the stock is not generating the kind of momentum that historically precedes sustained breakouts. The daily ATR of $9.97 confirms high volatility. Daily swings of nearly $10 are routine. Traders must price that risk into position sizing.
Short-Term Momentum Favors Rocket Lab Stock
Does near-term price action support Rocket Lab stock? Yes — the 1-hour chart shows a constructive setup, though the hourly 200 EMA at $104.49 looms as the next major test.
On the 1-hour chart, the RSI is at 67.44, approaching overbought but consistent with a strong trending move. The hourly MACD is decisively positive. The line reads 1.72 against a signal of -0.36, with a histogram of 2.09. This configuration signals clear short-term upward momentum. Price also trades above the hourly 20 EMA ($91.05) and 50 EMA ($93.43). Both reinforce the near-term bullish structure.
On the 15-minute chart, the picture is slightly more nuanced. RSI at 69.09 pushes near overbought territory. The MACD histogram has flipped lightly negative at -0.23. This suggests the intraday impulse may be losing steam near the close. The 15-minute Bollinger upper band sits at $100.48. The stock was pressing against intraday resistance into the final minutes of trading. This is not a reversal signal — it is a short-term cooling read. Traders considering entry timing should note that chasing the close carries higher consolidation risk.
The $101–$103 Battleground Defines Rocket Lab Stock’s Next Move
Where does Rocket Lab stock go from here? The $101–$103 zone is the critical inflection point — it aligns R1 ($101.42) with the converging 20-day and 50-day EMAs.
Notably, the daily pivot framework places key levels in useful context. The pivot point is at $95.63, with R1 at $101.42 and S1 at $92.23. Rocket Lab stock closed above its pivot, which is constructive. However, R1 at $101.42 aligns uncomfortably close to the EMA cluster. A clean daily close above $101–$103 would represent a meaningful structural shift. On the downside, $92.23 marks the first support zone. The lower Bollinger Band at $81.89 provides a deeper structural floor.
Bullish Scenario for Rocket Lab Stock
Can Rocket Lab stock sustain its rally? Yes, if the Iridium narrative drives buying through the $101–$103 resistance zone — the hourly setup already supports that attempt.
Fundamentally, the bullish case rests on both strategic and technical arguments. The Iridium acquisition is a genuine business transformation. Analysts noted that Rocket Lab outbid competitors including AST SpaceMobile for the asset. This signals bold strategic conviction from management. If the market continues to reward the vertical integration narrative, buying pressure could sustain a push through resistance. A daily close above $103 would likely trigger further technical buying. The daily regime would then shift toward bullish.
Bearish Scenario for Rocket Lab Stock
What could derail Rocket Lab stock? The daily MACD remains negative and all-stock deal dilution could create persistent seller pressure — if $101–$103 holds firm, downside risks intensify.
In contrast, the bearish case is grounded in technical reality. The daily MACD remains firmly negative. The stock is still below its key short-term moving averages. All-stock acquisitions of this scale often create persistent seller pressure. Target shareholders receive new stock and immediately hedge or liquidate. The $8 billion deal size represents significant dilution risk. If the EMA cluster holds as resistance and daily momentum fails to recover, Rocket Lab stock could slip back toward the $92 pivot support. A deeper test of the $85–$87 area would also be possible. A daily close below $89.85 — the session low — would invalidate the short-term recovery thesis entirely.
Overall, Rocket Lab stock sits at a genuinely pivotal technical juncture. The fundamental story has changed dramatically in 24 hours. The market’s initial reaction was emphatically positive. Yet the daily chart structure has not confirmed a new uptrend. It has only confirmed a sharp recovery bounce within a neutral regime. The $101–$103 zone will define the next chapter. Until that resistance breaks convincingly, the technical and fundamental theses remain in productive tension. Volatility is high. The deal introduces new uncertainties. Positioning here demands precision over conviction.
FAQ
Why did Rocket Lab stock surge 16%?
Rocket Lab stock jumped after the company announced an $8 billion all-stock deal to acquire Iridium Communications. The acquisition transforms RKLB from a pure-play launch provider into a vertically integrated space and satellite communications platform — what CEO Peter Beck called the missing “third leg” of the company’s vision.
Is Rocket Lab stock in a bullish trend?
Not yet. Despite the 16% rally, the daily MACD remains negative at -6.29 and the price closed below both the 20-day EMA ($102.79) and the 50-day EMA ($102.23). The daily regime is classified as neutral, not bullish. The stock is bouncing inside a corrective phase rather than trading in a confirmed uptrend.
What is the key resistance level for Rocket Lab stock?
The $101–$103 zone is the critical resistance area. It aligns R1 ($101.42) with the converging 20-day and 50-day EMAs. A clean daily close above this zone would signal a structural shift toward a bullish regime and likely trigger further technical buying.
What are the downside risks for Rocket Lab stock?
If the $101–$103 resistance holds, Rocket Lab stock could retreat to the $92.23 pivot support. A deeper test of the $85–$87 area is possible. A daily close below $89.85 — the session low — would invalidate the short-term recovery thesis. Additionally, the all-stock deal structure introduces dilution risk that could create persistent selling pressure.
Disclaimer: This article is for informational purposes only and does not constitute financial advice, an investment recommendation, or a solicitation to buy or sell any financial instrument or cryptocurrency. The analysis provided is not indicative of future results. Investing in crypto assets and financial markets carries a high risk of capital loss. Always do your own research (DYOR) and consult a qualified financial advisor before making any decision.
Article produced with the assistance of artificial intelligence and reviewed by the editorial team.


Ayrıca Şunları da Beğenebilirsiniz

BlackRock Transfers $212M in Bitcoin to Coinbase, Signaling ETF Activity

Belgium vs Senegal Tactical Preview: World Cup 2026 Game Plan, Key Battles and Match Prediction