Stellar (XLM) Trading Volume Soars 124%: Is This the Start of a Strong Bull Run?
- Stellar (XLM) is hovering at $0.17.
- The trading volume has skyrocketed by 124%.
With the market in extreme fear, all the major crypto assets are charted in red. Among them, Stellar (XLM) is attempting to move upward to hit its recent highs. With a modest 3% gain in value, its current price is hovering within the $0.1775 range.
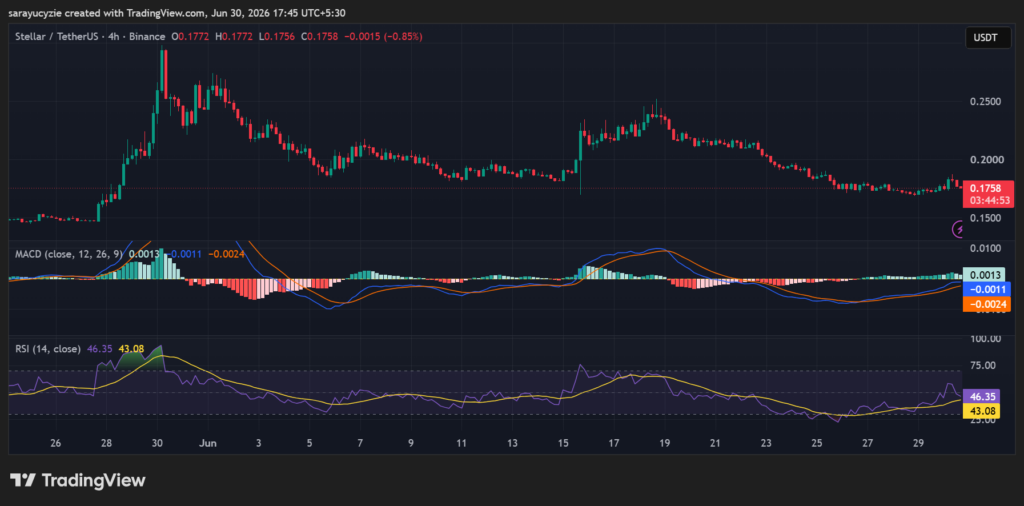
In the early hours, the asset traded at a bottom range of $0.172, and after testing and breaking through the levels between $0.1727 and $0.1865, XLM has climbed to a high of $0.1869. Moreover, the daily trading volume has skyrocketed by over 124% to $277.61 million.
The four-hour price chart of the XLM/USDT trading pair shows that the price might move in both up and down directions. If its recent gain has acquired more traction, the price would climb toward the resistance at the $0.18 range. With the prolonged correction on the upside, the bulls could break higher and hit higher targets.
On the flip side, with a bearish shift in the Stellar market, the price trend might trigger it to shed its gains. This could immediately initiate a drop below the support at around $0.16. A steady push on the downside with the emergence of the death cross would send the asset’s price even lower.
What’s the Next Move for Stellar?
When Stellar’s Moving Average Convergence Divergence (MACD) line is above the signal line, but both remain below the zero line, it suggests that bullish momentum is starting to build within a broader bearish trend.
The bullish crossover hints that buying pressure is improving, but the overall trend has not yet turned positive. Also, this signals an early recovery, though confirmation is needed before a stronger uptrend can be expected.
 (Source: TradingView)
Additionally, the daily Relative Strength Index (RSI) staying at 46.35 indicates neutral to slightly bearish momentum in the XLM market. Technically, the value is below the neutral level, exhibiting that the sellers have a small edge, but momentum remains fairly balanced.
The reading is above the oversold zone, so selling pressure is not strong enough. This points to a market in consolidation, where neither buyers nor sellers have clear control.
Crypto Market Highlights
FARTCOIN Bulls Take the Wheel: Can It Power Toward an Explosive Run?


Ayrıca Şunları da Beğenebilirsiniz
Best Crypto Trading Groups for Finding Opportunities in a Bear Market

Gold Price Stages Resilient Recovery, Nears $4,650 Amid Market Uncertainty