خرید ارز دیجیتال
بازارها
اسپات
فیوچرزBTC
پس انداز
مرکز رویداد
مرکز جوایز
بیشتر
جشن کارمزد 0
Most Bitcoin traders watch price candles. Smart traders also watch where the market is about to break. A BTC liquidation heatmap is a real-time visual tool that shows you exactly where clusters ofMost Bitcoin traders watch price candles. Smart traders also watch where the market is about to break. A BTC liquidation heatmap is a real-time visual tool that shows you exactly where clusters of

BTC Liquidation Heatmap: What It Is and How to Use It

Sep 21, 2026MEXC
6 دقیقه
اشتراک

Most Bitcoin traders watch price candles.
Smart traders also watch where the market is about to break.
A BTC liquidation heatmap is a real-time visual tool that shows you exactly where clusters of leveraged positions are waiting to be force-closed — and why those zones have a habit of attracting price like a magnet.
This guide explains what a Bitcoin heatmap is, how to read it, where to access one for free, and how active traders use it to make sharper decisions.

Key Takeaways


  • A BTC liquidation heatmap is a color-coded visual tool that maps where clusters of leveraged Bitcoin positions are estimated to be force-closed.
  • Yellow zones indicate high liquidation density and often act as price magnets, while dark or blue zones signal low concentration.
  • Zones above the current BTC price reveal at-risk long positions; zones below reveal at-risk short positions.
  • Traders use the heatmap to set smarter stop-losses, identify likely price targets, and anticipate liquidation cascades.
  • The heatmap works best as one layer in a broader strategy — always combine it with indicators like RSI, funding rate, and open interest for confirmation.
  • CoinGlass and CoinAnk both offer free, real-time BTC liquidation heatmap access with no account required.

What Is a BTC Liquidation Heatmap?

When a trader opens a leveraged Bitcoin position, the exchange calculates a specific price level at which that position will be automatically closed if the market moves too far against them.
That forced closure is called a liquidation.
The result is a visual snapshot of where the market is structurally fragile right now.


How to Read the BTC Liquidation Heatmap

The Bitcoin heatmap uses color to show concentration — the denser the liquidation cluster, the hotter the color.
Cool colors (dark/blue) represent price zones with relatively few leveraged positions at risk.
Hot colors (yellow/orange) mark zones where a massive volume of positions would be force-closed if price reaches that level.
Yellow zones are the most critical — price often gravitates toward them in what traders call a "magnet effect," making them useful for predicting likely support, resistance, and directional moves.
The vertical axis shows the intensity of the liquidation cluster.
The taller the bar, the stronger the estimated heatmap level — bigger bars signal zones where price is more likely to react sharply upon arrival.
Zones sitting above the current Bitcoin price reveal where long positions are at risk.
Zones sitting below the current price reveal where short positions face forced closure.

Where to Find a Live BTC Liquidation Heatmap

Two free platforms provide reliable BTC liquidation heatmap data that most active traders rely on.
CoinGlass is the most widely used.
It aggregates liquidation data across the derivatives market and presents it as a real-time color-coded heatmap, with multiple model views and a configurable liquidity threshold filter.
You can adjust the timeframe across multiple intervals, toggle between long and short views, and filter by leverage intensity to isolate the clusters that matter most to your time horizon.
CoinAnk is a strong alternative with a clean interface.
CoinAnk's liquidation heatmap is designed specifically to predict the price levels where large-scale liquidations are likely to occur, with visual intensity displays built to support trading decisions.
Both tools offer free access to their core BTC liquidation heatmap — no account is required for basic use, though advanced features may require a paid plan.


How Traders Use the BTC Heatmap to Make Decisions

The BTC heatmap is not a signal generator — it is a structural map of where market stress is hiding.
Here is how experienced traders actually apply it.


Using Yellow Zones as Price Targets

Dense yellow clusters on the Bitcoin liquidation heatmap are not random — they act as gravitational points.
High-volatility zones revealed by the heatmap often pull Bitcoin's price toward significant liquidation levels.
If a bright yellow zone sits $3,000 above the current price, that level is worth monitoring as a potential area of price reaction — though reaching it is never guaranteed.


Setting Stop-Losses Around Major Clusters

One of the most practical uses of the BTC liquidity heatmap is stop-loss placement.
Because traders can see where most leveraged positions are vulnerable, they can identify better areas to place stop-losses — beyond the main liquidation clusters rather than directly inside them.
Placing stops inside a dense zone almost guarantees getting swept before the real move happens.


Anticipating Liquidation Cascades

When price breaks through a large cluster, the move often continues further — though absorption without follow-through is also possible depending on broader market conditions.
When a short liquidation cluster sits above resistance and price breaks through, liquidated short sellers are forced to buy, creating a cascade that pushes price through the level faster than normal buying pressure alone.
Recognizing this on the liquidation heatmap BTC view lets traders ride momentum instead of fighting it.


Combining the Heatmap with Other Indicators

The BTC heatmap works best when it confirms what other tools are already suggesting.
When too many traders are over-leveraged in one direction, price often loses momentum to continue the trend and gains strength to reverse — combining liquidation zones with indicators like funding rate helps identify those turning points more reliably.
RSI divergence and open interest trends are the most common companions.


Matching Timeframe to Your Trading Style

Not every cluster on the BTC liquidation heatmap is relevant to every trader.
Scalpers should use the 1-hour or 4-hour heatmap to catch local wicks, while swing traders should focus on the weekly or monthly view — and always prioritize clusters that remain persistent on the map for several hours over short-lived noise.

FAQ


What does a BTC liquidation heatmap show?
It shows the price levels where clusters of leveraged Bitcoin positions are estimated to be force-closed if price reaches those zones.


Is the Bitcoin heatmap free to use?
Yes — CoinGlass and CoinAnk both provide free, real-time BTC liquidation heatmap access with no account required.


What is the difference between a liquidation map and a liquidation heatmap?
They refer to the same tool; "heatmap" specifically emphasizes the color-coded intensity layer that shows density of liquidation clusters.


How often does the BTC liquidation heatmap update?
Most platforms update the BTC liquidation heatmap frequently, though exact refresh rates vary by tool — check each platform's documentation for current specifications.


Can beginners use the Bitcoin liquidation heatmap?
Yes, but it works best once you understand basic leverage mechanics — treat it as a supporting layer, not a standalone trading signal.


Does the BTC heat map work for altcoins too?
Liquidation heatmaps are available for most major trading pairs, including Ethereum, XRP, and Solana, though Bitcoin has the most reliable data due to its higher trading volume.


Conclusion


The BTC liquidation heatmap gives you a layer of market intelligence that a price chart alone cannot provide.
Yellow zones tell you where the market is structurally stressed.
Color gradients show you where forced selling or buying is likely to accelerate price.
Used alongside technical indicators, the Bitcoin liquidity heatmap becomes one of the most practical tools a trader can keep open alongside their chart.
Start with CoinGlass, observe how price reacts when it approaches dense clusters, and build your pattern recognition before applying it to live positions on MEXC.
فرصت‌ های بازار
لوگو Bitcoin
قیمت لحظه ای Bitcoin(BTC)
$80,543.58
$80,543.58$80,543.58
+0.92%
USD
نمودار قیمت لحظه ای Bitcoin (BTC)
این مقاله توسط MEXC صرفاً با هدف اطلاع‌ رسانی ارائه شده است و به‌ هیچ‌ وجه توصیه مالی یا سرمایه‌ گذاری محسوب نمی‌ شود. بازارهای رمزارزی با ریسک‌ های قابل‌ توجهی همراه هستند. لطفاً پیش از اتخاذ هرگونه تصمیم سرمایه‌ گذاری، پژوهش مستقل انجام دهید یا با یک مشاور حرفه‌ ای واجد صلاحیت مشورت کنید. دیدگاه‌ های مطرح‌ شده در این مقاله لزوماً بیانگر نظرات MEXC یا شرکت‌ های وابسته به آن نیست.

مقالات پرطرفدار

بیشتر ببینید
گزارش تحقیقاتی هفتگی MEXC Alpha Trader | تورم فراتر از انتظارات در همه زمینه‌ ها در حالی که ETFها 228M$ خروج هفتگی ثبت کردند — آیا روایت کاهش نرخ بهره با «آزمون استرس» مواجه است؟

گزارش تحقیقاتی هفتگی MEXC Alpha Trader | تورم فراتر از انتظارات در همه زمینه‌ ها در حالی که ETFها 228M$ خروج هفتگی ثبت کردند — آیا روایت کاهش نرخ بهره با «آزمون استرس» مواجه است؟

هفته سوم اکتبر 2026 دوره آماری: 14 تا 20 اکتبر 2026 تاریخ قطع داده: 20 اکتبر 2026 روایت اصلی در طول هفته گذشته، بازار رمزارز ضعیف و در محدوده باقی ماند و تحت فشار داده های تورمی قوی تر از انتظار در

«Uptober» به مانع خورد: معکوس‌شدن جریان سرمایه ETFها هم‌زمان با ورود 17,733 BTC به بازار — خرید در کف یا خروج از بازار؟ | گزارش پژوهشی هفتگی آلفا تریدر MEXC

«Uptober» به مانع خورد: معکوس‌شدن جریان سرمایه ETFها هم‌زمان با ورود 17,733 BTC به بازار — خرید در کف یا خروج از بازار؟ | گزارش پژوهشی هفتگی آلفا تریدر MEXC

هفته دوم اکتبر 2026 دوره آماری: 7 اکتبر تا 13 اکتبر 2026 زمان نهایی جمعآوری دادهها: 13 اکتبر 2026 روایت اصلی در هفته گذشته، بازار ارز دیجیتال یک چرخه کامل شامل رشد مبتنی بر مومنتوم در اوایل اکتبر، م

افزایش نرخ بهره اجرایی شد و BTC به اوج 8 ماهه رسید — خبرهای بد در قیمت‌ ها لحاظ شده‌ اند یا شاهد رالی شورت اسکوئیز هستیم؟ | گزارش پژوهشی هفتگی معامله‌ گران آلفای MEXC

افزایش نرخ بهره اجرایی شد و BTC به اوج 8 ماهه رسید — خبرهای بد در قیمت‌ ها لحاظ شده‌ اند یا شاهد رالی شورت اسکوئیز هستیم؟ | گزارش پژوهشی هفتگی معامله‌ گران آلفای MEXC

هفته سوم سپتامبر 2026 دوره آماری: 16 تا 22 سپتامبر 2026 تاریخ نهایی دادهها: 22 سپتامبر 2026 روایت اصلی طی هفته گذشته، بازار ارزهای دیجیتال یک چرخه کامل شامل فشار پیش از اعلام تصمیم، تأیید سیاست پولی

گزارش هفتگی تحقیقات معامله‌ گر آلفای MEXC | واگرایی نادر NFP و ADP کشمکش بازار را تشدید کرد: افزایش نرخ بهره یا توقف؟

گزارش هفتگی تحقیقات معامله‌ گر آلفای MEXC | واگرایی نادر NFP و ADP کشمکش بازار را تشدید کرد: افزایش نرخ بهره یا توقف؟

هفته نخست سپتامبر 2026 دوره آماری: 2 سپتامبر 2026 تا 8 سپتامبر زمان نهایی جمعآوری دادهها: 8 سپتامبر 2026 روایت اصلی بازار ارزهای دیجیتال طی هفته گذشته تحتتأثیر دادههای اقتصاد کلان و تنشهای ژئوپلی

اخبار پرطرفدار

بیشتر ببینید

گزارش روزانه آنچین MEXC: ETF اسپات Bitcoin آمریکا هفته گذشته خروج خالص ۳۱۹ میلیون دلاری را ثبت کرد

گزارش روزانه آنچین MEXC: ETF اسپات Bitcoin آمریکا هفته گذشته خروج خالص ۳۱۹ میلیون دلاری را ثبت کرد

بازارهای کریپتو شاهد خروج سرمایه از ETFها، تغییرات نظارتی و روند رو به رشد توکنسازی بودند. نکات کلیدی شامل خوشبینی به عرضه اولیه سهام SpaceX، برنامههای سیاست توکنسازی SEC، گسترش مشتقات CFTC و زیرساخت
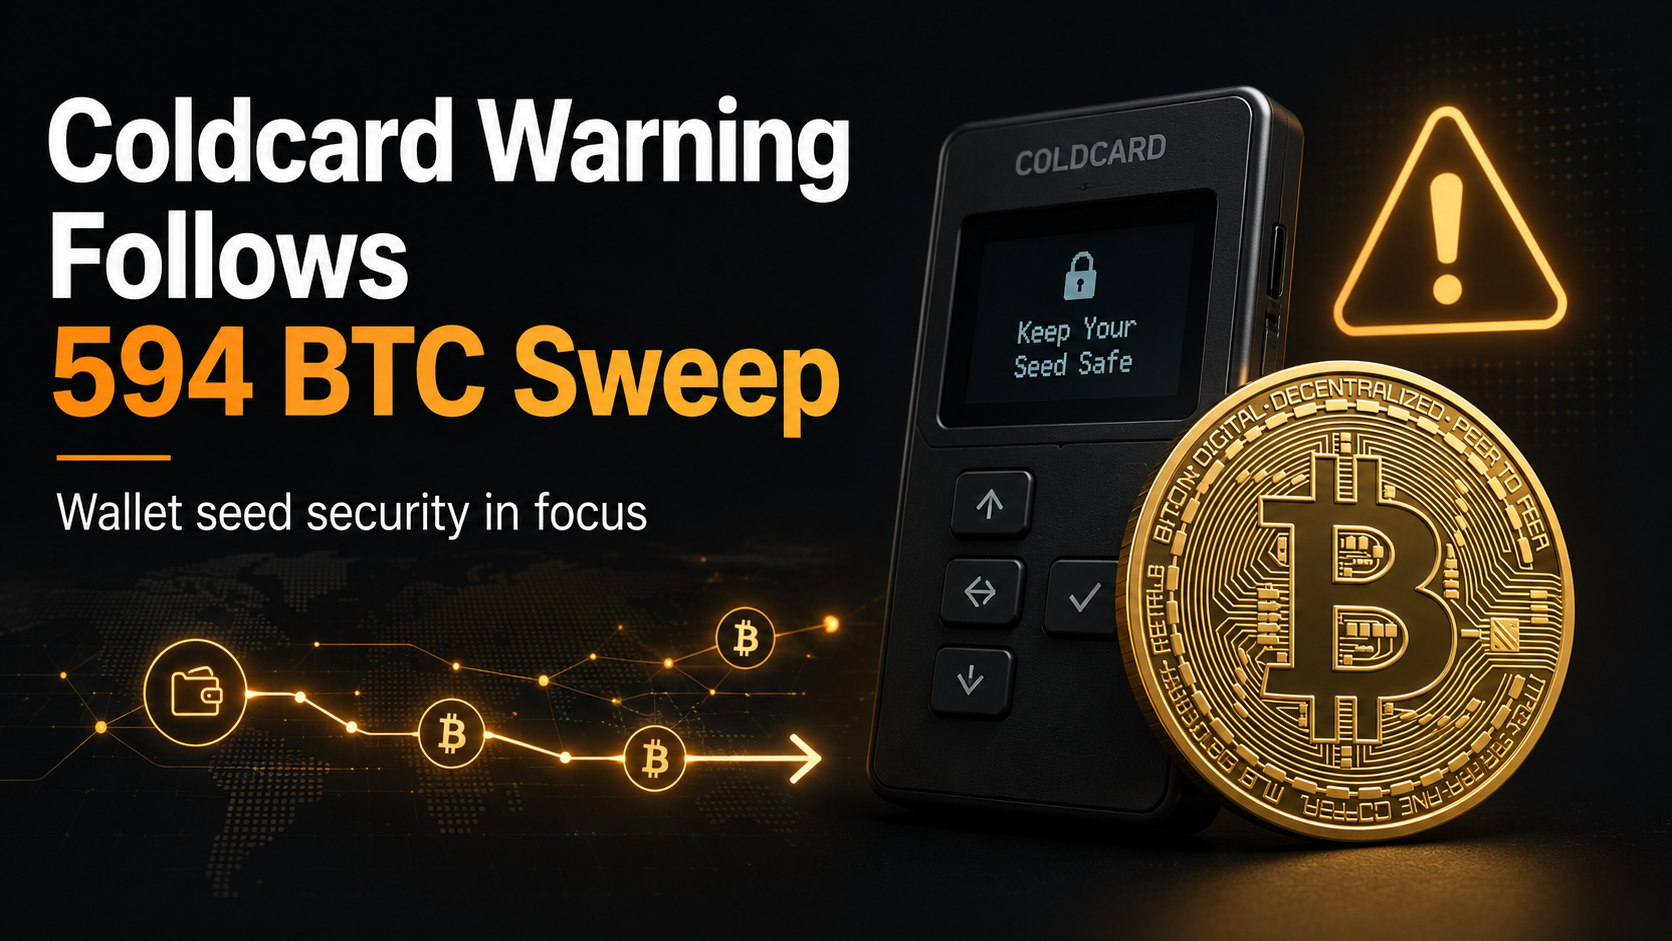
هشدار Coldcard Mk3 پس از جابجایی ۳۸ میلیون دلاری Bitcoin، اما علت همچنان تأیید نشده است

هشدار Coldcard Mk3 پس از جابجایی ۳۸ میلیون دلاری Bitcoin، اما علت همچنان تأیید نشده است

سازنده کیف پول سختافزاری بیت کوین، Coinkite، به کاربران درباره مشکلی در تولید عبارت بازیابی (Seed) که دستگاههای Coldcard را تحت تأثیر قرار میدهد، هشدار داده است؛ این مشکل شامل تمام نسخههای فریمور Mk3


مسترکارت خرید BVNK را تا مبلغ ۱.۸ میلیارد دلار تکمیل کرد—استیبل‌کوین‌ها وارد هسته پرداخت‌های جهانی می‌شوند

مسترکارت خرید BVNK را تا مبلغ ۱.۸ میلیارد دلار تکمیل کرد—استیبل‌کوین‌ها وارد هسته پرداخت‌های جهانی می‌شوند

مستر کارت در ۱۲ مرداد ۱۴۰۵، پس از اعلام این معامله در مارس، خرید ارائهدهنده زیرساخت استیبل کوین BVNK را تکمیل کرد.

نسبت حجم معاملات اسپات DEX به CEX به ۲۴٪ می‌رسد، در حالی که فعالیت صرافی‌های متمرکز کاهش می‌یابد

نسبت حجم معاملات اسپات DEX به CEX به ۲۴٪ می‌رسد، در حالی که فعالیت صرافی‌های متمرکز کاهش می‌یابد

نسبت حجم معاملات اسپات صرافیهای غیرمتمرکز به حجم معاملات اسپات صرافیهای متمرکز در ژوئیه ۲۰۲۶ به ۲۴.۱۴٪ رسید، بر اساس سری دادههای فعلی The Block. این رقم به این معنا نیست که صرافیهای غیرمتمرکز (DEX) ۲۴

مقالات مرتبط

بیشتر ببینید
لری فینک و بیت‌کوین: از «شاخص پول‌شویی» تا پیش‌بینی BTC 700K$

لری فینک و بیت‌کوین: از «شاخص پول‌شویی» تا پیش‌بینی BTC 700K$

کمتر تغییر نظری در امور مالی به اندازه مسیر لری فینک با Bitcoin اهمیت دارد.مدیرعامل BlackRock از اینکه BTC را ابزار یک مجرم مینامید به راهاندازی بزرگترین صندوق Bitcoin جهان رسید — و این داستان همهچیز

بیت‌کوین مالزی: قیمت BTC به رینگیت، وضعیت قانونی و نحوه شروع کار

بیت‌کوین مالزی: قیمت BTC به رینگیت، وضعیت قانونی و نحوه شروع کار

مالزی یکی از کنجکاوترین بازارهای آسیای جنوبشرقی نسبت به ارز دیجیتال است و بیتکوین در مرکز این گفتگو قرار داردچه بهدنبال جدیدترین قیمت بیتکوین در مالزی باشید، چه کنجکاو باشید که آیا داشتن BTC قانونی اس

ذخیره بیت‌کوین تگزاس چیست؟ SB 21، ماینینگ و معنای آن

ذخیره بیت‌کوین تگزاس چیست؟ SB 21، ماینینگ و معنای آن

تگزاس دیگر فقط نظارهگر بازار بیتکوین نیست — بلکه بهطور فعال در حال شکلدادن به آن استاز قانونگذاری تاریخی برای ذخیره بیتکوین تا یکی از بزرگترین صنایع استخراج بیتکوین در کشور، ایالت لون استار در عمل تعر


دفتر سفارش بیت‌کوین توضیح داده شد: عمق BTC، اسپرد و تحلیل هیت‌مپ

دفتر سفارش بیت‌کوین توضیح داده شد: عمق BTC، اسپرد و تحلیل هیت‌مپ

بیشتر معاملهگران بیتکوین تمام وقت خود را روی نمودارهای قیمت میگذرانند — اما دفتر سفارش BTC داستان متفاوتی را نشان میدهد.این به شما نشان میدهد پول واقعی کجا نشسته و منتظر خرید یا فروش است، قبل از اینکه

در MEXC ثبت نام کنید
ثبت نام کنید و تا 10,000 USDT پاداش دریافت کنید

به انجمن MEXC بپیوندید

جدیدترین لیست‌ شدن‌ ها، رویدادها و به‌ روزرسانی‌ ها را به‌ صورت لحظه‌ ای و مستقیماً از کانال رسمی تلگرام MEXC دریافت کنید.

بیش از 25k عضو

فیوچرز

GOLD(XAU)/USDT