In cryptocurrency trading, candlestick charts are an essential tool for traders' daily market analysis. Among them, the price line and high-low price lines are fundamental yet critical components ofIn cryptocurrency trading, candlestick charts are an essential tool for traders' daily market analysis. Among them, the price line and high-low price lines are fundamental yet critical components of
Learn/Trading Guide/User Guide/How to Quic...Price Lines

How to Quickly Draw Price Lines and High/Low Price Lines

Sep 18, 2025MEXC
0m
4
4$0.008651+0.25%

In cryptocurrency trading, candlestick charts are an essential tool for traders' daily market analysis. Among them, the price line and high-low price lines are fundamental yet critical components of technical analysis. Understanding and using them correctly can help traders better interpret market trends and price movements, enabling more informed trading decisions.


1. What is the Price Line and High–Low Price Line?


1.1 What is the Price Line?


The price line generally refers to the mark of the closing price for the current period on the chart. In a cryptocurrency candlestick chart, connecting the closing prices within a given time range forms the familiar line chart.

1.2 What is the High–Low Price Line?


The high–low price line refers to the line formed by the highest price and the lowest price in a candlestick chart. This line shows the price range for each trading period and provides key information on price volatility and range.

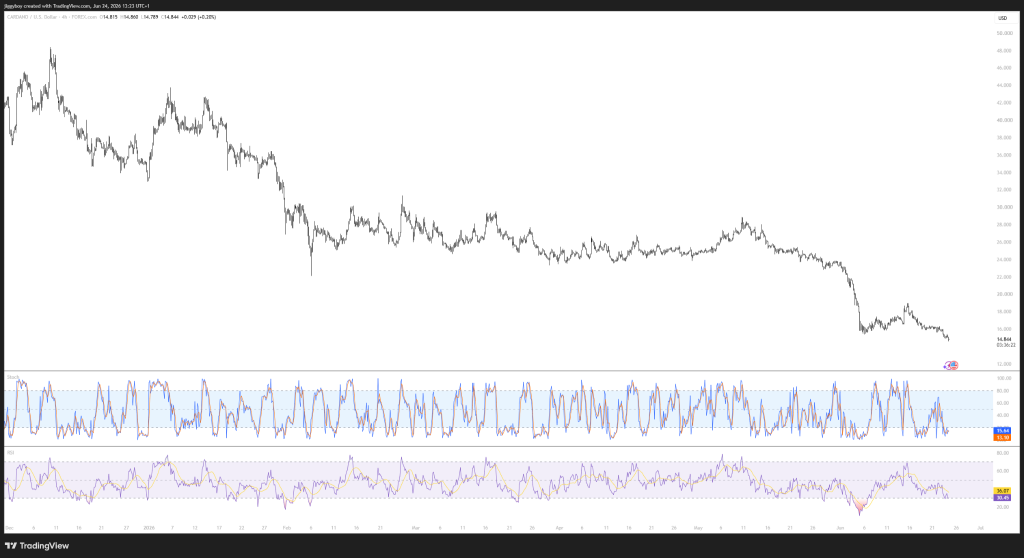
2. How to Read the Price Line and the High–Low Price Line?


As shown in the figure below, for BTC perpetual futures between July 24 and July 27, the high–low price line marks a highest price of 119,445.2 USDT and a lowest price of 114,672.9 USDT. This indicates the price range during that period. Meanwhile, the green price line at 116,829.8 USDT represents the current market closing price for BTC perpetual futures.


3. Three Key Benefits of the Price Line and High–Low Price Line


Trend Analysis: A line chart formed by connecting price lines helps traders analyze the overall price trend, whether the price is in an uptrend, downtrend, or sideways movement. Combined with the movement of the high–low price line, it further confirms price trends and volatility. If the price line rises continuously, it signals strong buying pressure; conversely, a continuous decline indicates bearish dominance.

Identifying Support and Resistance Levels: The high–low price line shows the full range of price fluctuations, which helps traders identify key support and resistance levels. In technical analysis, previous highs often serve as resistance, while previous lows serve as support. This allows traders to set stop-loss and take-profit levels based on market structure, reducing the risk of blind trades.

Informing Trading Decisions: Price lines and high–low price lines assist in developing trading strategies and determining entry or exit points. When the price line breaks above the resistance level formed by the high–low price line, it often indicates strong upward momentum, a potential buy signal. Conversely, when the price line falls below the support level formed by the high–low price line, it suggests heightened downside risk, a potential sell signal.

4. How to Quickly Draw Price Lines and High–Low Price Lines on MEXC


On the MEXC Futures trading page, right-click anywhere on the basic candlestick chart. In the quick-access menu that appears, select Price Line or High–Low Price Line to draw them instantly.


Note: When you scroll the candlestick chart horizontally or switch the time interval (e.g., 1 minute, 5 minutes, 1 hour, etc.), the displayed time range on the chart will change, and the high–low price lines you drew will adjust accordingly. However, the price line will still display the most recent closing price and will remain unchanged.

5. Mastering Basic Analysis Tools to Improve Trading Performance


The price line and high/low lines are among the most fundamental yet highly practical tools in candlestick chart analysis. For beginner traders, they provide a quick way to build an initial understanding of market rhythm and price volatility. For more experienced traders, they serve as an important reference point to support strategic decision-making, helping to optimize both entry and exit points.

While price lines and high/low lines can visually reflect market trends, combining them with other common technical indicators, such as the Parabolic SAR, TradingView charting tools, or Schiff Pitchforks, can further enhance accuracy and improve the stability of trading strategies.

Whether in a bull or bear market, mastering and effectively applying these basic charting tools helps traders minimize emotional interference and adopt a more rational, systematic approach to planning trades, ultimately improving the scientific rigor and execution of their overall trading strategy.


Disclaimer: This material does not constitute advice on investments, taxes, legal matters, finance, accounting, consulting, or any other related services, nor is it a recommendation to buy, sell, or hold any assets. MEXC Learn provides information for reference only and does not constitute investment advice. Please ensure you fully understand the risks involved and invest cautiously. All investment decisions and outcomes are the sole responsibility of the user.

Market Opportunity
4 Logo
4 Price(4)
$0.00864
$0.00864$0.00864
-0.80%
USD
4 (4) Live Price Chart

Popular Articles

View More
Why Is XRP Going Up Right Now? The Iran Ceasefire, The Strait Of Hormuz, And What It Means For XRP

Why Is XRP Going Up Right Now? The Iran Ceasefire, The Strait Of Hormuz, And What It Means For XRP

XRP surged roughly 7 percent on the week after the United States and Iran announced a ceasefire agreement on June 14, bouncing hard off a four-month low as geopolitical fear started to lift. The

Will HOOD Stock Hit $191 by 2030? Robinhood Stock Price Prediction and Analyst Targets

Will HOOD Stock Hit $191 by 2030? Robinhood Stock Price Prediction and Analyst Targets

Robinhood (NASDAQ: HOOD) spent most of 2025 doing something it had never managed before: convincing Wall Street to take it seriously. The stock climbed from an all-time low of $6.81 in 2022, and from

How to Read US Stock Pre-Market and After-Hours Unusual Movements: Distinguishing Real Signals from Short-Term Noise

How to Read US Stock Pre-Market and After-Hours Unusual Movements: Distinguishing Real Signals from Short-Term Noise

Pre-market and after-hours trading sessions allow investors to buy and sell stocks outside the regular 9:30 AM to 4:00 PM ET exchange window. Price moves during these sessions carry real information,

How to Read U.S. Stock Market Signals: Price Action, Volume, Breakouts, and Sector Rotation

How to Read U.S. Stock Market Signals: Price Action, Volume, Breakouts, and Sector Rotation

For most traders, looking at a stock chart for the first time feels like trying to read a foreign language. A stock is up 4% in the pre-market—is that a buy signal, or a trap? A chart breaks past a

Hot Crypto Updates

View More
KAZAR ($KAZAR): What It Is and How to Buy in 2026

KAZAR ($KAZAR): What It Is and How to Buy in 2026

Discover what KAZAR AI ($KAZAR) is, how it works, its tokenomics, price history, and how to buy KAZAR on MEXC in 2026. Full research guide. Summary KAZAR AI is an Ethereum-based cryptocurrency

SpaceX Ticker Set for Nasdaq Debut on July 7, 2026: What Investors Need to Know

SpaceX Ticker Set for Nasdaq Debut on July 7, 2026: What Investors Need to Know

For years, investors could only watch from the sidelines as SpaceX remained one of the world's most valuable private companies. Now, that has changed. While early reports pointed to a July 7, 2026

Massive Put Pressure: Bitcoin Options OI Nears $34.5B as Traders Pile Into Downside Bets

Massive Put Pressure: Bitcoin Options OI Nears $34.5B as Traders Pile Into Downside Bets

Overview Bitcoin's derivatives market is sending one of its clearest distress signals in months. Total bitcoin options open interest across all major exchanges has climbed toward $34.5 billion, even

Mbappe vs. Yamal vs. Kane: Who Was Born to Win the 2026 World Cup Golden Ball?

Mbappe vs. Yamal vs. Kane: Who Was Born to Win the 2026 World Cup Golden Ball?

Overview The 2026 FIFA World Cup — the largest in history with 48 teams and 104 matches across three nations — is now underway. Three names dominate every pre-match conversation: Kylian Mbappe, the

Trending News

View More
Cynthia Lummis opens final review window for CLARITY Act text

Cynthia Lummis opens final review window for CLARITY Act text

Months of negotiations have brought the CLARITY Act to its final review stage, with Senator Cynthia Lummis confirming a July 4 release of the updated text ahead

Trump canceled housing bill signing, delaying 4-year CBDC ban

Trump canceled housing bill signing, delaying 4-year CBDC ban

🚨 Trump canceled the housing bill signing, stalling the 4-year CBDC ban in $BTC policy. 📢 The move links progress to legislation on voter citizenship proof. ⏳ Washington

Is the Worst Finally Over for Cardano? Here’s What the ADA Charts Say

Is the Worst Finally Over for Cardano? Here’s What the ADA Charts Say

The ADA price is under pressure again. Cardano dropped 4% in the last day to $0.1466. The rest of the crypto market barely moved. So this wasn’t about Bitcoin or

LIVE: Bitcoin crashes to $59,000 as crypto wipes out $2.4 trillion in total market cap

LIVE: Bitcoin crashes to $59,000 as crypto wipes out $2.4 trillion in total market cap

Bitcoin has dropped below $60,000 and is now down nearly 20% this month. The total crypto market cap has fallen from $4.3 trillion in October to $2.0 trillion today

Related Articles

View More
What Is MEXC Earn?

What Is MEXC Earn?

1. What is MEXC Earn?MEXC Earn is a one-stop product launched by MEXC to help users discover a variety of token-holding earning opportunities. It covers flexible savings, fixed savings, and on-chain e

How to Deposit Crypto to MEXC App: MetaMask & Wallet Transfer Guide

How to Deposit Crypto to MEXC App: MetaMask & Wallet Transfer Guide

If you have crypto in other wallets or platforms, you can choose to transfer them to the MEXC platform for trading.How to Deposit Crypto to the MEXC PlatformStep 1: Open the MEXC App on your mobile ph

How to Deposit Crypto to the MEXC Platform (Website)

How to Deposit Crypto to the MEXC Platform (Website)

If you have crypto in other wallets or platforms, you can choose to transfer them to the MEXC platform for trading.How to Deposit Crypto to the MEXC PlatformStep 1: Open your browser and log in to the

MEXC Customer Support in One Click

MEXC Customer Support in One Click

When using MEXC's services, you might encounter different kinds of issues. To help users resolve any problems they might encounter, MEXC has made it easy to get immediate access to online customer ser

Sign Up on MEXC
Sign Up & Receive Up to 10,000 USDT Bonus
Kickoff Fest! Win Up to $500K!
Kickoff Fest! Win Up to $500K!Kickoff Fest! Win Up to $500K!
4 rewards! 1st trade bonus & 0-fee limit orders!